Near-Real-Time Welfare and Livelihood Impacts of an Active Civil War: Evidence from Ethiopia
This study examines the immediate impacts of an ongoing conflict in Ethiopia on food security, livelihood activities, and market disruptions. Using high-frequency survey data, the research sheds light on the consequences of the civil war and discusses the importance of timely data collection during conflicts.
Uploaded on | 3 Views
Download Presentation

Please find below an Image/Link to download the presentation.
The content on the website is provided AS IS for your information and personal use only. It may not be sold, licensed, or shared on other websites without obtaining consent from the author. If you encounter any issues during the download, it is possible that the publisher has removed the file from their server.
You are allowed to download the files provided on this website for personal or commercial use, subject to the condition that they are used lawfully. All files are the property of their respective owners.
The content on the website is provided AS IS for your information and personal use only. It may not be sold, licensed, or shared on other websites without obtaining consent from the author.
E N D
Presentation Transcript
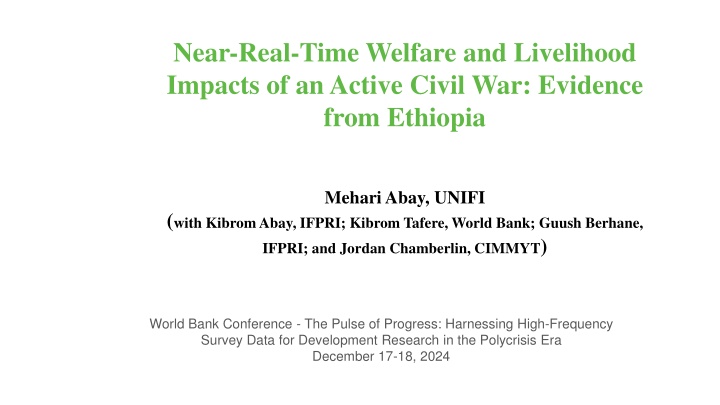
Near-Real-Time Welfare and Livelihood Impacts of an Active Civil War: Evidence from Ethiopia Mehari Abay, UNIFI (with Kibrom Abay, IFPRI; Kibrom Tafere, World Bank; Guush Berhane, IFPRI; and Jordan Chamberlin, CIMMYT) World Bank Conference - The Pulse of Progress: Harnessing High-Frequency Survey Data for Development Research in the Polycrisis Era December 17-18, 2024
1. Introduction While much of the earliest work on the impacts of violent conflict is cross-country in nature, the availability of household survey data in the last decade has generated some recent micro-level studies (e.g., Akresh et al., 2012; Br ck et al., 2019; Martin-Shields and Stojetz, 2019). The micro studies that have focused on African conflicts have typically examined delayed outcomes observed many years following conflict. Most micro-level studies evaluating the impact of violent conflict suffer from several data related limitations. oThe outbreak of violent conflict disrupts traditional data collection efforts oTracking the trajectory of outcomes associated with violent conflict may require high-frequency data oThere are limited studies on immediate disruptions in livelihoods, supply chains and markets during conflicts
2. What do we do and contribute? This paper provides fresh evidence on the ex durante impacts of an on-going conflict on food security and livelihood activities. We use the unique WB High-Frequency Phone Survey (HFPS) data We merge these HFPS with the Armed Conflict Location and Event Data (ACLED). We make several key contributions to this literature: oWe provide quantitative ex durante study of the microeconomic consequences of an active large-scale conflict oWe also document disruptions to livelihood pursuits and food markets. oWe discuss how similar data collection efforts could be best be mobilized
3. Context and data Political disagreements between the Ethiopian federal government and the Tigray regional state ensued into full-scale war on November 4th, 2020. The war involved the Ethiopian federal army and its allied forces (e.g., Eritrean army) on the one side and the armed forces of the Tigray region on one side. The conflict initially played out in Tigray while also spilling over into parts of Amhara and Afar regions. Banking, telephone, electricity, transport, and other basic services were suspended. After weeks of intense fighting, the federal forces took control of the regional capital Mekelle at the end of November 2020.
After capturing the regional capital Mekelle, the federal government installed a provisional regional government in Tigray that lasted until June 2021 The conflict moved southwards into neighboring Amhara and Afar regions when the Ethiopian federal army and allied forces left Tigray in June 2021 The expansion of the war into neighboring Amhara and Afar regions have caused further economic damages in those regions. The HFPS data are monthly survey cover the period until May 2021 This forces us to focus on impacts of the first phase of the civil conflict, which was confined to the Tigray region.
Figure 1 presents the distribution of battles (August 2019-October 2020) and after the outbreak of the war (November 2020-May 2021). Based on conflict event records in the Armed Conflict Location and Event Data (ACLED). Battles were sparsely and evenly distributed across regions before November 2020. During November 2020 - May 2021, there was a dramatic spike in battle events.
3.1. Data and data source We use the World Bank s HFPS data, conducted between April 2020-May 2021 The phone survey sample is a subsample drawn from the LSMS-ISA 2019. The LSMS-ISA 2019 data are nationally representative sample of 6,770 households. Of which 3,247 of them were successfully interviewed in the first phone survey in April 2020 These households were re-interviewed every 3-4 weeks, for 11 rounds, until May 2021 The 2019 baseline data provide detailed characteristics of households, including GPS coordinates, which we used to merge these data with the ACLED database.
Table A2: Sample of households interviewed across survey rounds The HFPS sample continually declined in follow-up rounds due to non-response and attrition. The sample from Tigray was especially affected by the war itself and disruptions in telecommunication Our analysis is based on the panel of households interviewed in the pre-war and post-war-onset phone surveys. The phone sample may differ in systematic ways from the original 2019 sample To account for these systematic non-responses in the phone surveys, we constructed inverse probability sampling weights. Our final sample consists of those households appearing (at least once) in the pre-war and post-war-onset phone survey rounds Round Baseline 1 2 3 4 5 6 7 8 9 10 11 Time/month 19-Aug 20-Apr 20-May 20-Jun 20-Aug 20-Sep 20-Oct 20-Nov 20-Dec 21-Jan 21-Feb 21-May All regions 6770 3,247 3,105 3,056 2,876 2,768 2,702 2,535 2,221 2,076 2,176 1,982 Outside Tigray region 6094 2,915 2,782 2,737 2,569 2,465 2,412 2,277 2,144 1,992 2,041 1,896 Tigray region 676 332 323 319 307 303 290 258 77 84 135 86
Measuring Key Outcomes The paper focuses on three broad categories of outcomes. These are: oHousehold food insecurity experience oHouseholds access to food markets oParticipation in labor market and livelihood activities. Food insecurity is measured using the Food Insecurity Experience Scale (FIES) Households were asked whether they were able to buy enough staple foods Labor market participation of household members in the last 7 days or one month.
4. Empirical strategy We start with the following DID specification: ? ??= ? + ?1????????+ ?2??????? ????????+ ?3? ??+ ? ?? Where ? ?? stands for a measure of outcomes ? stands for household-specific fixed effects. ???????? stands for an indicator variable equal to 1 for the post-war-onset period, the period after November 2020, zero otherwise. The first stage of the war, November 2020 to June 2021 took place in Tigray and later expanded to neighboring regions of Amhara and Afar in late June 2021.
We estimate the following disaggregated DID specification: ?1 ?2 ? ??= ? + ??+ ????????? ? ? = ? + ????????? ? ? = ? + ? ?? ?=1 ?=?1+1 ?? is a vector of month or round dummies. Pre-war survey rounds 1 to M1 while post-war-onset range from M1+1 to M2. The third (interaction) term captures Tigray specific pre-war trends The fourth (interaction) term captures Tigray specific trends immediately after the outbreak of the war in November 2020.
The first two approaches consider Tigray as the treatment region With this definition, our estimates measure intention to treat (ITT) impacts. We generate more granular measures of exposure using ACLED s battle events ? ??= ? + ??+ ?1??????? ??+ ? ?? where ??????? ?? stands for the cumulative number battles experienced within 20 km or 30 km radius. The follow-up phone surveys are prone to systematic non-response and attrition. To account for these systematic non-responses, we construct and employ sampling weights. Estimates may be lower bound
5.1 Results and Discussion: DID results The conflict led to 38 PP increase in moderate or severe food insecurity. Incidence of food insecurity in Tigray is 26 percentage points higher Table 2: The Impact of violent conflict on aggregate measures of food insecurity (1) (2) (3) Moderate or severe food insecurity -0.014 (0.017) 0.384*** (0.052) Yes 0.008 0.361 14523 Food insecure Raw score Wartime dummy Tigray Wartime dummy Household fixed effects R-squared Mean dep. var (pre-war) No. observations -0.025 (0.015) 0.261*** (0.033) Yes 0.004 0.557 14523 -0.073 (0.106) 1.607*** (0.236) Yes 0.007 2.054 14523
5.1 Results and Discussion: DID results The war increased households experience of alternative forms of food insecurity The conflict increased the share of households who skipped meals by 39 PP Table 3: The Impact of violent conflict on experience of food insecurity (1) (2) (3) (4) (5) (6) Run out of food (7) Hungr y but did not eat -0.015 (8) Worried not enough food Unable to eat healthy foods 0.001 (0.018) 0.344*** (0.055) Yes 0.006 0.429 14524 Ate few kinds of food Skipped meal Ate less food Didn t eat all day -0.049*** (0.015) 0.388*** (0.081) Yes 0.010 0.221 14524 -0.053*** (0.019) 0.364*** (0.087) Yes 0.008 0.287 14524 Wartime dummy Tigray Wartime dummy Household fixed. eff R-squared Mean dep. var No. observations -0.004 (0.015) 0.251*** (0.047) Yes 0.003 0.387 14524 0.003 (0.021) 0.343*** (0.051) Yes 0.006 0.427 14524 -0.011 (0.022) (0.019) -0.025 (0.036) (0.040) Yes 0.000 0.183 17196 0.005 (0.020) -0.041 (0.044) Yes 0.000 0.062 17196 0.046 Yes 0.000 0.098 17196
5.1 Results and Discussion: DID results The war disrupted households overall labor market participation. The war caused 10 and 15 PP decline in non-farm business and wage activities On the contrary, participation in farm activities remained unaffected/increased Table 5: The Impact of violent conflict on labor market and livelihood activities (1) (2) (3) (4) Any activity Farm activity Non-farm business -0.013* (0.008) -0.097*** (0.025) Yes 0.002 0.241 28558 Wage related activities 0.020*** (0.008) -0.151*** (0.029) Yes 0.003 0.417 21940 -0.031*** (0.007) 0.032* (0.018) Yes 0.003 0.313 28558 Wartime dummy Tigray Wartime dummy Household fixed effect R-squared Mean dep. var (pre-war) No. observations 0.016 (0.010) -0.101* (0.057) Yes 0.001 0.801 21940
5.3 Results Based on ACLED Data An additional battle within 20 km of residence increases moderate or severe food insecurity by 1 PP. The impact of exposure to battles increase the closer the battles get to the household Table 9: Number of battles and food security (1) (2) (3) Food insecurity (4) Food insecurity (5) (6) Raw score Moderate or severe food insecurity 0.010*** (0.001) Moderate or severe food insecurity 0.008*** Raw score 0.007*** (0.001) 0.040*** (0.007) Battles within 20km Battles within 30km 0.005*** 0.031*** Household fixed effects R-squared Mean dep. var (pre-war) No. observations (0.001) Yes 0.021 0.361 14374 (0.001) Yes 0.010 0.557 14374 (0.005) Yes 0.022 2.054 14374 Yes 0.020 0.361 14374 Yes 0.009 0.557 14374 Yes 0.021 2.054 14374
5.3 Results Based on ACLED Data An additional battle leads to about 0.5 PP reduction in livelihood activity. An additional battle leads to 0.2 PP decrease in non-farm business activities No impact on farm activities, signifying the resilience of the agriculture sector Table 11: Armed conflict and livelihood activities (1) (2) Any activity activity (3) Farm activity (4) Farm activity (5) Non- farm business -0.002** (0.001) Yes 0.004 0.241 28247 (6) Non- farm business -0.002*** (0.001) Yes 0.005 0.241 28247 (7) Wage related activities -0.002** (0.001) Yes 0.004 0.417 28247 (8) Wage related activities -0.002*** (0.001) Yes 0.005 0.417 28247 Any Battles within 20 km -0.005*** Battles within 30 km Household fixed eff. R-squared Mean dep. var No. observations 0.000 (0.001) Yes 0.013 0.313 28247 (0.002) Yes 0.012 0.801 21704 -0.004*** (0.001) Yes 0.012 0.801 21704 0.001 (0.000) Yes 0.013 0.313 28247
6. Concluding Remarks Using HFPS and ACLED data, we show that the Ethiopian civil war led to significant disruptions to livelihoods with adverse impacts on food security and access to food. Seven months into the conflict, the outbreak of the civil war increased the probability of moderate to severe food insecurity by 38 percentage points. Exposure to one additional battle leads to a 1 PP increase in the probability of moderate to severe food insecurity. Non-farm and wage-related activities have been the most affected by the conflict, while farming activities have been relatively more resilient. Economic activities in urban areas have been more affected than those in rural areas.

![❤[PDF]⚡ Civil War Talks: Further Reminiscences of George S. Bernard and His Fel](/thumb/20551/pdf-civil-war-talks-further-reminiscences-of-george-s-bernard-and-his-fel.jpg)


