Neighborhood Characteristics & Pedestrian Injury Severity: Analysis & Findings
This study examines the impact of neighborhood characteristics and the built environment on pedestrian injury severity to enhance pedestrian safety. It analyzes factors such as pedestrian behaviors, driver characteristics, and roadway conditions to understand the severity of pedestrian injuries. The research identifies practical and methodological research gaps that need further investigation in this field.
Download Presentation

Please find below an Image/Link to download the presentation.
The content on the website is provided AS IS for your information and personal use only. It may not be sold, licensed, or shared on other websites without obtaining consent from the author.If you encounter any issues during the download, it is possible that the publisher has removed the file from their server.
You are allowed to download the files provided on this website for personal or commercial use, subject to the condition that they are used lawfully. All files are the property of their respective owners.
The content on the website is provided AS IS for your information and personal use only. It may not be sold, licensed, or shared on other websites without obtaining consent from the author.
E N D
Presentation Transcript
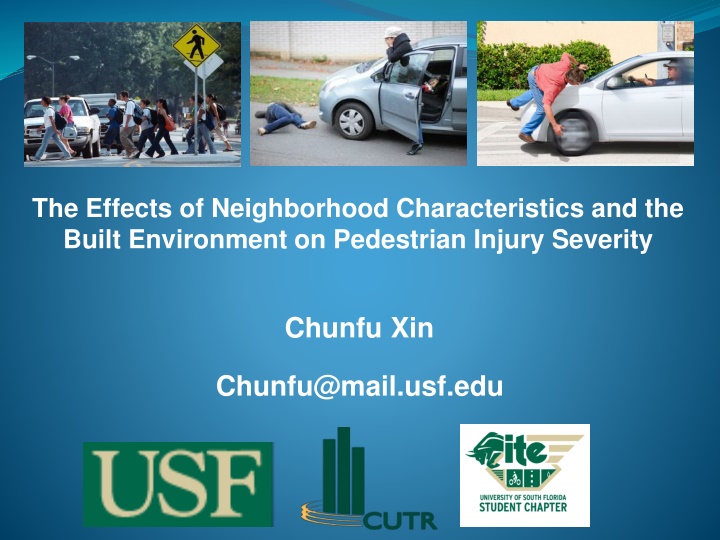
The Effects of Neighborhood Characteristics and the Built Environment on Pedestrian Injury Severity Chunfu Xin Chunfu@mail.usf.edu
Outline Background Literature Review & Objective Data Collection Statistical Methodology Estimation Results Major Findings Conclusions 1
Background 25% of trips by automobile are within a 20-minute walk[1]. Walking, as an active travel mode, can address the multiple woes of traffic congestion[2]. Pedestrian safety issues have to be addressed to improve public confidence in walking. To develop proactive and effective countermeasures, it is important to investigate and understand major contributing factors to pedestrian crash occurrence and its resulting injury severities. 2
Background In 2015, there were 5,376 pedestrians (15% of total traffic fatalities) killed and 70,000 injured in traffic crashes in US[3]. In 2015, about 12% of total pedestrian fatalities occurred in Florida. 3
Literature Review Pedestrian Crash Frequency (NB, Poisson, RPNB, RP-) Pedestrian Injury Severity (Variables) (1) Pedestrian characteristics & walking behavior (2) Driver characteristics & driving behavior (3) Vehicle type & traffic characteristics (4) Roadway characteristics & environmental factors (5) Neighborhood characteristics & built environment Pedestrian Injury Severity (Ordinal, Nominal) (1) Two levels, Three levels, Four levels, and Five levels (2) BL, MNL, RPBL, ML; OPM, OLM, GOPM, MGOPM, RP- 4
Research Gaps (Practical) Pedestrian s and driver s behaviors are associated with neighborhood characteristics and culture. Transportation infrastructure facilities are related to neighborhood characteristics and built environment. e.g., The low-income areas typically are served by more limited infrastructure, e.g., lighting, the presence of sidewalks, crosswalks, and traffic calming devices[4]. Most researchers focus on evaluate the effects of neighborhood environment on pedestrian crash frequency. The impacts of an area s characteristics on pedestrian injury severity need more investigation. 5
Research Gaps (Methodology) ?? = ????+ ?? ??= ? ?? ??,? 1< ?? ??,? ??,?= ??,? 1+ exp ??,?+ ??,???,? ??= ? + ????+ ??exp ?????? ??,?= ??+ ??,???,?+ ??,?exp ??,???,???,? ? ??= ? = ??,? ???? ??,? 1 ???? ? ? ? ? ? ? ???? ? ? ? ? ?? ????,??,?,??,? = ?=1 ?=1 ????? ? ??= ? 6
Possible Issue Unobserved Contributing Factors[5]. Crash factors: e.g., impact angle; impact speed. Human factors: e.g., physical condition, pedestrian response. Unobserved Heterogeneity Issue Unobserved contributing factors vary over observations. Be related to an explanatory variable (e.g., age, gender). Consequences Biased and inconsistent parameter estimates Erroneous inferences and predictions 7
Research Objective To quantify the effects of demographics and neighborhood environment on pedestrian injury severity; To identify the other risk factors; To address the unobserved heterogeneity issue. 8
Data Collection Scope of Study (1) District 7, FL (2) 2011-2014 (3) 3,867 pedestrian-involved crashes Five Major Data Sources (1) Crash Data (FDOT Crash Analysis Reporting System) (2) Road Environment (FDOT GIS Shapefiles/Geodatabases) (3) Transit Data (General Transit Feed Specification) (4) Demographic Data (US Census Bureau) (5) Land Use Data (Florida Geographic Data Library) 9
Data Collection Road Environment Lighting Intersection Speed limit Weather Traffic control Divided road Neighborhood Bus stops Department store Bars Schools African American Community Crash Severity Demographic Age Male Household income Distracted driver Aggressive driving Pedestrian crossing Alcohol 10
Descriptive Analysis Injury Severity (K:8.6%; A:26.5%; B:36.8%; C:21.1%; O:7.0%) Bus stops (73.6%) Schools (53.0%) Mixed Stores (54.4%) Bars (12.0%) High income (58.4%) Male pedestrian (62.3%) Teen driver (5.2%) Alcohol or drug involvement (2.8%) African Community 12
Statistical Methodology A Random Parameters Generalized Ordered Probability Model with Heterogeneity in Means and Variances 13
Major Findings New Model Structure (Additional Insight) The heterogeneity in means and variances of random parameter for elderly pedestrian indicator was found to be related to intersection, which relaxed the limitation of fixed distribution parameters of random parameters in traditional mixed generalized ordered probability models. Compared to younger pedestrians (age 30), 74.3% of elderly pedestrians (50 < age 65) who are involved in intersection-related crashes are more likely to result in severe injury, 52.4% of elderly pedestrians who are not involved in intersection-related crashes are more likely to result in severe injury. 15
Major Findings Neighborhood Characteristics and Built Environment African American community, school zone, and bus stop area The presence of a school within a 0.5km-buffer from a crash: (1) fatal injury: decrease (2) incapacitating: increase African American community, bus stop area: decrease (FI) Unsafe Behaviors are identified for: bus stop area school zone African American community 16
Conclusions Family educational campaigns can be targeted at both teen drivers (15 age 19) and younger pedestrians (age 30) to improve their risk awareness about unsafe driving behaviors (e.g., aggressive driving, distracted driving) and unsafe walking behaviors (e.g., pedestrian dart-out or dash, playing). Extensive education programs can be targeted at middle-age (30 < age 50) and elderly pedestrians (50 < age 65) to increase their risk awareness about walking behaviors involved with alcohol or drugs. 22
Conclusions Engineering countermeasures (e.g., low speed limits, rumble strips, intelligent pedestrian crossing system, effective pedestrian protection crossing system, lighting facilities, speed reduction markers, colorful pavement) should be implemented in the influence areas of bus stops or schools. Enforcement countermeasures (e.g., higher penalty on aggressive driving, distracted driving, drinking and driving, speed limit violation) should be conducted in cooperation with the education countermeasures and engineering countermeasures listed above. 23
More Info 24
References Gotschi, T., & Mills, K. (2008). Active transportation for America: The case for increased federal investment in bicycling and walking. Frumkin, H., Frank, L., & Jackson, R. J. (2004). Urban sprawl and public health: Designing, planning, and building for healthy communities. Island Press. Traffic Safety Fact Sheet Pedestrians. (2015). Gibbs, K., Slater, S. J., Nicholson, L., Barker, D., & Chaloupka, F. J. (2012). Income disparities in street features that encourage walking. Bridging the Gap. Washington, S. P., Karlaftis, M. G., & Mannering, F. (2011). Statistical and econometric methods for transportation data analysis. CRC press. 1. 2. 3. 4. 5. 25
