Neighborhood Department FY2019 Budget Overview
Discover the proposed FY2019 budget presentation for the Department of Neighborhoods, including details on expenditures, revenues, and key highlights. Gain insights into the department's organizational structure, services provided, and financial breakdown.

Download Presentation

Please find below an Image/Link to download the presentation.
The content on the website is provided AS IS for your information and personal use only. It may not be sold, licensed, or shared on other websites without obtaining consent from the author. If you encounter any issues during the download, it is possible that the publisher has removed the file from their server.
You are allowed to download the files provided on this website for personal or commercial use, subject to the condition that they are used lawfully. All files are the property of their respective owners.
The content on the website is provided AS IS for your information and personal use only. It may not be sold, licensed, or shared on other websites without obtaining consent from the author.
E N D
Presentation Transcript
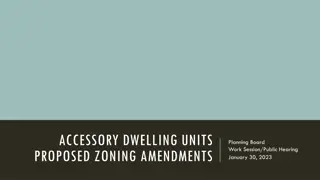
[Department of Neighborhoods] FY2019 Proposed Budget Presentation May 17, 2018
Org Chart DEPARTMENT OF NEIGHBORHOODS 110.1 FTEs $11,255,702 Director s Office 9.9 FTEs $1,289,009 Provides executive support and leadership to all divisions of the department. Provides all divisions with services in budget, purchasing, receiving grants, receiving funds and account payables. Inspections & Public Service 72.2 FTEs Enforces City codes pertaining to dangerous buildings, weeded lots, junked motors vehicles and unlawfully placed signs upon the City s right-of-way. Responds to emergencies caused by natural disaster. Provides timely and effective customer service to the public. Citizens Assistance Office 11.0 FTEs Through community liaisons, ensures responses and resolutions to Mayoral priorities, community complaints, provides education about city services to the community, and supplements other city departments with project staffing. Primary liaison to Super Neighborhood Association & CIP meetings. Anti-Gang Office 15.0 FTEs The division develops and implements programs that serve youth, families, and communities through direct services, volunteer initiatives, collaboration, outreach, education, and policy development. $988,178 $1,490,045 $7,268,521 Office of New Americans and Immigrant Communities 2.0 FTEs $219,949 In partnership with community-based organizations and volunteers reaches out to Houston s diverse community of immigrants, ex-patriates and refugees to facilitate successful civic, economic and cultural integration as members of our community. The division oversees the Welcome Houston Committee, the iSpeak Houston Language Access Program, Citizenship Month, World Refugee Day, and Citizenship Forums. 2
Revenues By Funds ($ in thousands) Variance FY19 Prop/FY18 Budget FY17 Actual FY18 Budget FY18 Estimates FY19 Proposed % Fund Change General Fund $3,087 $4,233 $3,739 $2,414 $ (1,325) (35.4%) Total $3,087 $4,233 $3,739 $2,414 $ (1,325) (35.4%) 3
FY2019 - Revenues Highlights The FY2019 Budget reflects a reduction in revenue due to one-time revenue transfer of $2.1 million from HPW Building Inspector Special Fund for FY2018. 4
Expenditures By Funds ($ in thousands) Variance FY19 Prop/FY18 Budget FY17 Actual FY18 Budget FY18 Estimates FY19 Proposed % Fund Change General Fund $11,143 $11,358 $11,358 $11,256 $ (102) (0.9%) Total $11,143 $11,358 $11,358 $11,256 $ (102) (0.9%) 5
FY19 Personnel vs Non Personnel (one fund per slide) ($in thousands) 6
Department Budget Reductions (in thousands) Fund FY17 FY18 FY19 3-Year Total General Fund $196 $26 $523 $745 Total $196 $26 $523 $745 7
Department Budget Reductions Cont. (in thousands) FY 2017 Budget Reductions: Elimination of 2 positions within Volunteer Initiatives Program and Inspection and Public Services. (reduction includes all operating cost associated with Volunteer Initiatives Program Volunteer services no longer provided as an independent division. Decrease in funds for Supplies and Services FY 2018 Budget Reductions Reduction in Temporary staffing. One time Special Transfer of all inspector positions from General Fund to HPW Building Inspector Special Fund ($2.1M). FY 2019 Budget Reductions Elimination of 1 Community Outreach Coordinator position within the Director s Office. Outreach and awareness efforts will be coordinated amongst 3 remaining staff members. Reduction of funds available to support overages from limited funding available through Community Block Grant Funds (CDBG) funds. 8
FY2019 Budget Expenditures Net Change (in thousands) FY2019 General Fund Budget Expenditures Net Change to FY2018 Current Budget FY2018 Current Budget Operating Budget Notes $ 10,440 1 Restricted Budget $ 918 FY2018 Current Budget $ 11,358 Explanation of FY2018 Incremental Increase/(Decrease) Operating Budget Adjustments Budget reduction initiatives (523) Subtotal Operating Budget Adjustments $ (523) % Change from FY17 Operating Budget (5.0%) Contractual or Mandated Adjustments: Health Benefits Active Civilian Health Benefits Active Classified (if applicable) Municipal Pension Classified Pension (if applicable) Restricted Accounts Program Adjustment Subtotal Contractual/Mandated Increases $ $ $ 76 - 329 - 16 (0) 421 FY2019 Proposed Budget Operating and Contractual Adjustments $ $ (102) 11,256 FY2019 Proposed Budget % Change from FY18 Current Budget (0.9%) Notes: 1. Restricted Budget includes service chargeback accounts for items such fuel, electricity, IT accounts, etc. 9
FY2019 - Expenditures Highlights The FY2019 Budget includes a reduction of $523,023 for department savings initiative. 10
Functional Org Chart (in thousands) DIVISION FTE COUNT BUDGET COSTS $ Director s Office 110001 9.9 1,290 Inspections & Public Services 110002 72.2 7,267 Citizens Assistance Office 110003 11.0 988 Anti-Gang 110004 15.0 1,490 Volunteer Initiatives 110005 0 0 Office of New Americans and 110006 Immigrant Communities 2.0 220 People with Disabilities 110007 0 0 Education Affairs 110008 0 0 Sign Enforcement 110009 0 0 11
Questions 12
Appendix DEPARTMENTDEMOGRAPHICS GENERAL FUND 13
Appendix DEPARTMENTDEMOGRAPHICS CDBG FUND 14
FY 2019 Performance Measures FY17 Actual FY18 Budget FY18 Estimates FY19 Proposed Customer Measures Priorities Percent of anti-Gang Program Youth Who Completed Program Services Public Safety, Complete Communities 90% 90% 84% 89% Public Safety, Complete Communities Percent of Anti-Gang Youth Who Reoffend 4% 10% 10% 10% Public Safety, Complete Communities Youth Served Through Anti-Gang Programs 6,242 6,500 6,821 6,500 FY17 Actual FY18 Budget FY18 Estimates FY19 Proposed Business Process Measures Priorities Public Safety, Complete Communities Average Daily Inspections 286 320 300 320 Public Safety, Complete Communities Average Days from Inspection to Initial inspection 13 10 25 10 Public Safety, Complete Communities Dangerous Buildings Demolished 542 425 425 425 Public Safety, Complete Communities Junked Motor Vehicles Resolved 2,991 3,000 3,000 3,000 Public Safety, Complete Communities Weeded Lots Cut 11,800 10,000 9,299 10,000 15