Nested Model for Additive Variance Drivers
Analyzing gene-level and SNV-level additive variances within different tissues such as breast, CNS, kidney, liver, ovary, pancreas, prostate, and skin. The study provides insights into the coding and non-coding regions, highlighting potential drivers of genetic variation. Explore the results and implications of the additive variance models.

Download Presentation

Please find below an Image/Link to download the presentation.
The content on the website is provided AS IS for your information and personal use only. It may not be sold, licensed, or shared on other websites without obtaining consent from the author. If you encounter any issues during the download, it is possible that the publisher has removed the file from their server.
You are allowed to download the files provided on this website for personal or commercial use, subject to the condition that they are used lawfully. All files are the property of their respective owners.
The content on the website is provided AS IS for your information and personal use only. It may not be sold, licensed, or shared on other websites without obtaining consent from the author.
E N D
Presentation Transcript
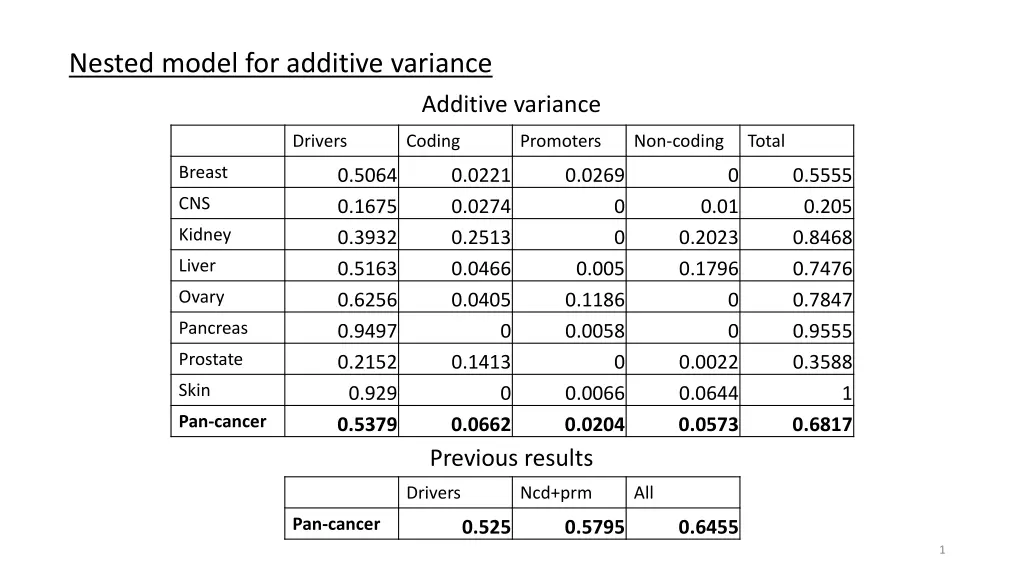
Nested model for additive variance Additive variance Drivers Coding Promoters Non-coding Total Breast 0.5064 0.1675 0.3932 0.5163 0.6256 0.9497 0.2152 0.929 0.5379 0.0221 0.0274 0.2513 0.0466 0.0405 0.0269 0 0.5555 0.205 0.8468 0.7476 0.7847 0.9555 0.3588 CNS 0 0 0.01 Kidney 0.2023 0.1796 Liver 0.005 0.1186 0.0058 Ovary 0 0 Pancreas 0 Prostate 0.1413 0 0.0022 0.0644 0.0573 Skin 0 0.0066 0.0204 1 Pan-cancer 0.0662 Previous results 0.6817 Drivers Ncd+prm All Pan-cancer 0.525 0.5795 0.6455 1
Gene-level additive variances & q-values Gene-level additive variances & q-values Non-coding +Coding Non-coding +Coding Breast 40.6% q = 0.094 53.6% q= 0.0013 Breast - q = ns - q= - PCAWG Neutral Model MoatV Results CNS 0.3% q = 0.47 9.2% q = 0.097 CNS 2.56% q = 0.78 11.29% q = 0.14 Kidney 51.7% q = 0.026 65.6% q = 6.4e-9 Kidney - q = - - q = - Liver 99.9% q = 2e-10 100% q = 1.9e-9 Liver - q = - - q = - Ovary 64.2% q = 0.12 63.5% q = 5.4e-6 Ovary 46.92% q = 0.2694 72.49% q = 0.004 Pancreas 83.2% q = 4.1e-5 72.5% q = 0.0012 Pancreas 90.86 q = 0.0 81.07 q = 0.0001 Prostate 18% q = 0.27 29.6% q = 1.4e-5 Prostate 21.76% q = 0.3398 26.75% q = 0.004 Skin 74.8% q = 1e-4 75.5% q = 7.2e-5 Skin - q = - - q = - Median: 64.55 (43.7) FDR < 0.1 Med: 57.95(41.4) FDR < 0.1 Med: 34.34(40.4) FDR - Median: 49.62 (47.8) FDR -
SNV-level additive variances & q-values SNV-level additive variances & q-values Non-coding +Coding Non-coding +Coding Breast 42.9% q = 3.6e-9 46.4% q = 4e-9 Breast 41.9% q = 1e-8 45.1% q = 7e-9 PCAWG Neutral Model CNS 15.3% q = 2e-4 19.2% q = 1e-4 CNS 15.2% q = 7e-4 19% q = 1e-4 MoatSim Results Kidney 52% q = 1.5e-11 56.7% q = 1.6e-11 Kidney 54.1% q = 5e-11 58.2% q = 3e-11 Liver 67.8% q = ~0 74.8% q = ~0 Liver - q = - - q = - Ovary 59.2% q = 4.4e-12 67.7% q = 4.8e-12 Ovary 62.3% q = 6e-11 67.1% q = 6e-11 Pancreas 87.1% q = ~0 90% q = ~0 Pancreas - q = - - q = - Prostate 60.9% q = 1.8e-10 66.7% q = 1.8e-10 Prostate 60.1% q = 3e-10 65.3% q = 1e-10 Skin 14.6% q = 9e-4 21.6% q = 9e-4 Skin - q = - - q = - Drivers only: Median: 52.5 Median: (46.1) FDR < 0.001 Median: 61.7(51.34) FDR < 0.001 Median: (46.7) FDR - Median: (50.94) FDR - 4
Gene-level additive variances & q-values Gene-level additive variances & q-values Non-coding +Coding Non-coding +Coding Breast 40.6% q = 0.094 53.6% q= 0.0013 Breast 1.3% q = ns 48.4% q= 7.2e-6 PCAWG Neutral Model CNS 0.3% q = 0.47 9.2% q = 0.097 CNS 0% q = - 9.2% q = 0.26 MoatSim Results Kidney 51.7% q = 0.026 65.6% q = 6.4e-9 Kidney 0% q = - 65.8% q = 6.5e-8 Liver 99.9% q = 2e-10 100% q = 1.9e-9 Liver - q = - - q = - Ovary 64.2% q = 0.12 63.5% q = 5.4e-6 Ovary 0% q = - 60.3% q = 1.6e-5 Pancreas 83.2% q = 4.1e-5 72.5% q = 0.0012 Pancreas - q = - - q = - Prostate 18% q = 0.27 29.6% q = 1.4e-5 Prostate 0.4% q = - 26.5% q = 0.0003 Skin 74.8% q = 1e-4 75.5% q = 7.2e-5 Skin - q = - - q = - Med: 57.95(34.9); FDR < 0.1 Med: 0; FDR - Median: 64.55(44.3) FDR < 0.1 Median: 48.4(42.5) FDR < 0.001 4 (Except CNS,Ov,Prost) (Except CNS)