Net Foreign Liabilities of Retail Banks 2002-2010
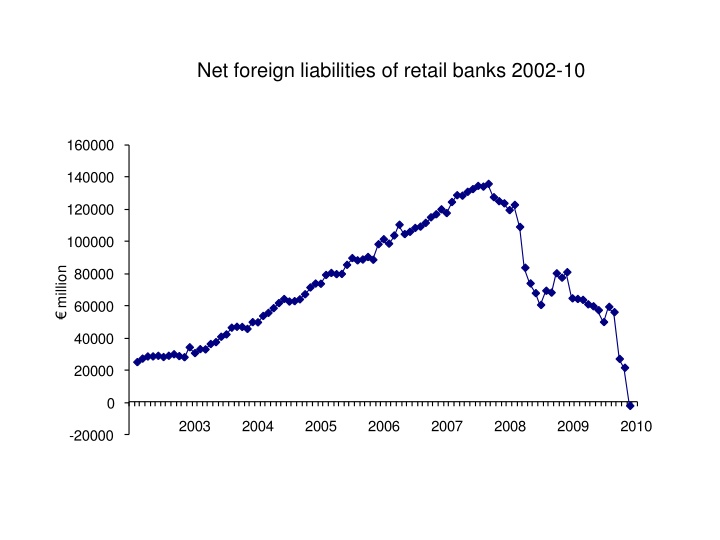
The data showcases the net foreign liabilities of retail banks from 2002 to 2010 in millions. It also includes information on relative scales of austerity compared to bank bailout, Ireland's GDP and GNP from 1999 to 2014, total employment in Ireland, construction employment, and real house prices in Dublin.

Download Presentation

Please find below an Image/Link to download the presentation.
The content on the website is provided AS IS for your information and personal use only. It may not be sold, licensed, or shared on other websites without obtaining consent from the author.If you encounter any issues during the download, it is possible that the publisher has removed the file from their server.
You are allowed to download the files provided on this website for personal or commercial use, subject to the condition that they are used lawfully. All files are the property of their respective owners.
The content on the website is provided AS IS for your information and personal use only. It may not be sold, licensed, or shared on other websites without obtaining consent from the author.
E N D
Presentation Transcript
Net foreign liabilities of retail banks 2002-10 160000 140000 120000 100000 million 80000 60000 40000 20000 0 2003 2004 2005 2006 2007 2008 2009 2010 -20000
Relative scale: austerity compared to bank creditor bail-out 35 bn 30 Annual 25 20 Austerity relative 2008 budget 15 10 Bkg contribution to deficit 5 0 -5 2012 2008 2009 2010 2011 2013 2014 2015 180 bn 160 Cumulative 140 120 Austerity relative 2008 budget 100 80 60 Bkg contribution to deficit 40 Note: Based on Smyth and Barnes, 2013; IBRC not treated as Govt sector; ignores deficit reducing guarantee fees etc post 2013. 20 0 2008 2009 2010 2011 2012 2013 2014 2015
Relative scale: austerity compared to bank creditor bail-out 40 bn Annual 35 30 25 Austerity relative 2008 budget 20 Bkg contribution to deficit 15 10 Bkg outlay including investment 5 0 -5 180 2008 2009 2010 2011 2012 2013 2014 2015 bn 160 Cumulative 140 120 Austerity relative 2008 budget 100 80 Bkg contribution to deficit 60 Bkg outlay including investment 40 Note: Banking data based on Smyth and Barnes, 2013; IBRC not treated as Govt sector; ignores deficit reducing guarantee fees etc post 2013. Green bar includes the value of the Government s holdings of bank equity 20 0
Ireland: GDP, GNP 1999-2014 Quarterly mn 50000 45000 40000 GDP GNP 35000 30000 25000 99 00 01 02 03 04 05 06 07 08 09 10 11 12 13 14
Ireland: Total employment thousands, quarterly 1999-2014 2200 2100 2000 1900 1800 1700 Total employment 1600 99 00 01 02 03 04 05 06 07 08 09 10 11 12 13 14
Ireland: Construction employment thousands, quarterly 1999-2014 280 260 240 220 200 180 160 140 120 Construction employment 100 80 99 00 01 02 03 04 05 06 07 08 09 10 11 12 13 14
Real House Prices Dublin 1996-2014 350 300 250 200 150 100 Dublin ESRI Dublin CSO 50 Q1 1996 Q1 1998 Q1 2000 Q1 2002 Q1 2004 Q1 2006 Q1 2008 Q1 2010 Q1 2012 Q1 2014
Irish 10-year yields and spread over bunds 1995-2015 14 12 10 Ireland % Germany 8 6 4 2 0 Jan-01 Jan-95 Jan-96 Jan-97 Jan-98 Jan-99 Jan-00 Jan-02 Jan-03 Jan-04 Jan-05 Jan-06 Jan-07 Jan-08 Jan-09 Jan-10 Jan-11 Jan-12 Jan-13 Jan-14 Jan-15
Irish 10-year yields and spread over bunds 2007-2013 14 12 10 Ireland % Germany 8 6 4 2 0