Net Jobs Generation & GHG Emissions Reduction with Biogas in Southern Brazil
Context & motivation for replacing fossil fuels with renewable biogas in Southern Brazil to achieve NDC goals. Explore potential net job creation and GHG emissions reduction through partial substitution of conventional energy sources with biogas. Methodological approach involves input-output matrices and models for assessing economic and environmental impacts.
Download Presentation

Please find below an Image/Link to download the presentation.
The content on the website is provided AS IS for your information and personal use only. It may not be sold, licensed, or shared on other websites without obtaining consent from the author. If you encounter any issues during the download, it is possible that the publisher has removed the file from their server.
You are allowed to download the files provided on this website for personal or commercial use, subject to the condition that they are used lawfully. All files are the property of their respective owners.
The content on the website is provided AS IS for your information and personal use only. It may not be sold, licensed, or shared on other websites without obtaining consent from the author.
E N D
Presentation Transcript
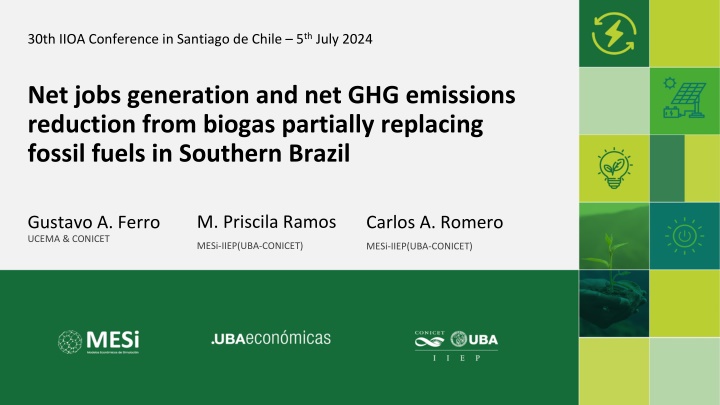
30th IIOA Conference in Santiago de Chile 5thJuly 2024 Net jobs generation and net GHG emissions reduction from biogas partially replacing fossil fuels in Southern Brazil M. Priscila Ramos Gustavo A. Ferro UCEMA & CONICET Carlos A. Romero MESi-IIEP(UBA-CONICET) MESi-IIEP(UBA-CONICET)
OUTLINE 01 DATA & MODEL 02 03 SCENARIO &RESULTS 04 INTRODUCTION CONCLUSION
01 INTRODUCTION Context & motivation 70 % of GHG emissions due to the use of fossil fuels Solution: progressive replacement with renewable energies. Brazil middle-class industrial-based country (10thin GDP in the world). energy matrix relatively clean - hydroelectricity: 65% of the electricity matrix - great potential for biogas production (today 3.4 % of the potential) - great diversity of substrates (agricultural, agro-industry, waste &sewage) - in an extended geography. NDC goals: - 45 % share of renewable energies in its energy matrix by 2030. - to reduce dependence of hydroelectricity (because of climate variability) - to incentivize self-production & distributed generation.
01 INTRODUCTION Context & motivation 18% of biog s produced in m dium- small plant in the Sourthern regi n (62% in Southeast regi n with m dium-large plants) 71% of biog s produce by urban solid wastes & sewage treatment 70% of biog s to generate electricity Source: https://cibiogas.org/ Biog sMAP
01 INTRODUCTION Objectives & Hypothesis OBJ: To explore the reach of net job creation and net GHG emissions reduction from the partial substitution of conventional energy sources by renewables (biogas) in Southern Brazil. HYP: Regional economic growth in the Southern Brazil with - Net job creation: because biogas industries are more labor intensive than fossil fuel energy generation. - Net GHG emissions reduction: since biogas industries generate lower GHG emission levels than conventional energy sources.
02 DATA & MODEL Methodological Approach MODEL & SHOCKS DATA BIOAGR: Agriculture and Cattle BIOSLA: Slaughterhouses BIOMIL: Flour Mills BIOSUG: Sugar and Alcohol BIOFOO: Beer breweries, dairy and other food processors BIOWAS: Solid waste and sewage treatment BIOGAS (6 new sectors) 3 Input-Output Matrices RG, SC, PR 2018 with 6 BIOGAS sectors. 3 IOM Southern Brazil 2018 with BIOGAS Investment In Biogas capacity 3 Input- Output Models for the Sourthern Brazil FLQ and RAS/CE Satellite accounts of Employment & GHG emissions Production of Biogas RG: Rio Grande do Sul SC: Santa Catarina PR: Paran IOM (3 states)
02 DATA & MODEL Characterization of Biogas sectors in the Southern Brazil Electricity Equivalent Biogas Production Employment in Biogas MM Nm3 / ton of substrate 40.88 (*) 98.62 Jobs (#) per MM Nm3 MWh (1,510*MM Nm3) Sector BIOAGR BIOSLA BIOMIL BIOSUG BIOFOO BIOWAS Total MM Nm3 Jobs (#) 60 29 22 65 6 121 303 771 222 88 413 77 13 8 4 6 13 16 12 89,996 43,579 33,447 98,890 8,773 182,770 457,455 5.90 13.43 82.92 NA 1,923 3,494
02 DATA & MODEL Southern Brazil 2018 baseline Biog s Production GHG Electricity Equivalent Employment in Biogas emissions Jobs (#) per MMNm3 of Biogas Jobs (#) per MM 2018 USD of Value Added States MWh MM 2018 USD MM Nm3 Jobs (#) MtCO2e (1,510*MM Nm3) PR 196 48 1,669 9 208 102.8 295,990 SC 28 9 481 17 373 40.8 42,250 RS 79 27 1,344 17 295 89.6 119,215 Total 303 85 3,494 12 252 233.2 457,455
02 DATA & MODEL Southern Brazil 2018 baseline Sector Paran Rio Grande do Sul Santa Catarina Total BIOAGR BIOSLA+BIOMIL+BIOSUG+BIOFOO BIOWAS 17.9% 58.2% 23.9% 6.5% 8.6% 84.9% 69.0% 5.4% 25.6% 19.7% 40.4% 40.0% Biogas production (MM Nm3) 78.9 28.0 196.0 47% 9% 302.9 48% 7% % of used installed capacity % used of potential (substrates) 66% 6% 31% 3% Employment in biogas 460 165 571 1,197 0.008% % of total employment of the state 0.011% 0.008% 0.005% GHG emissions (MtCO2e) 89.6 40.8 102.8 10.4% 233.2 23.6% % of total GHG emissions of the country 9.0% 4.1%
03 SCENARIOS & RESULTS Scenarios design General assumptions: 50 percent of potentially recoverable biomass used to produce biogas in each sector/region Investment required in biog s plants (time to build = 10 years) All biogas used to produce electricity that substitutes thermal power generation. Power generation plants located in the rest of Brazil (outside the Southern regi n) Costs of biog s production includes transport costs of biomass 3 scenarios that combine the following parameters of energy efficiency, technology of the power plants, direct labor productivity in biogas Scenarios Energy Efficiency (kWh/m3 biogas) Power plant technology (investment costs) in million USD per MW Labor productivity direct (000 USD/job) 1.51 2.81 5.93 1.5 3.1 4.5 100.3 149.4 292.8 Low Base High
03 SCENARIOS & RESULTS Results comparison for biogas in the Southern Brazil Average annual results (direct and total, including indirect) during the 10 years of biogas sector investments and production horizon. Biogas Production (MM USD) GHG Emissions (Mtco2e) Employment (jobs) Scenarios Direct TOTAL 1,416 Direct TOTAL Direct 9,441 TOTAL 16,097 Non linearity in job creation: Low 650 0.01 -0.07 824 1,729 0.06 -0.46 10,090 19,130 Base (-) with greater L productivity (+) with greater energy efficiency 1,301 2,585 0.18 -1.37 16,380 31,942 High Scale of Investment Substitution of termal by biog s power generation
04 SCENARIOS & RESULTS Base Scenario results by biogas origin (sector/state) . Production (MM USD) GHG Emissions (Mtco2e) Direct TOTAL 257 546 119 263 38 80 87 186 26 52 296 602 824 1,729 Employment (jobs) Direct 3,073 1,220 391 1,163 293 3,950 10,090 Direct 0.02 0.01 0.00 0.01 0.00 0.02 0.06 TOTAL 0.05 -0.10 -0.03 -0.06 -0.02 -0.30 -0.46 TOTAL 5,607 2,302 1,043 2,424 508 7,245 19,130 BIOAGR BIOSLA BIOMIL BIOSUG BIOFOO BIOWAS TOTAL Production (MM USD) Direct 308 279 237 824 Emissions (Mtco2e) Direct 0.02 0.02 0.02 0.06 Employment (jobs) Direct 5,547 2,468 2,075 10,090 State TOTAL 623 582 524 1,729 TOTAL -0.24 -0.12 -0.09 -0.46 TOTAL 10,814 4,330 3,986 19,130 Paran Rio Grande do Sul Sana Catarina TOTAL
04 Conclusions CONCLUSION Regional IO models for three states of Brazil 2018 with detailed representation of sectors that produce substrates for biogas Scenarios based on the Southern Brazil biogas potential to produce clean electricity Substantial employment creation in biogas production that could be extended in the whole Brazilian territory because of different sectors related to the biog s substracte (waste & sewage; agricultura & cattle; food industries) Cleaning the electricity matrix with biogas production for self-generation (or distributed power generation) to be aligned with the Paris Agreement to reduce GHG emissions and to support sectoral-environmental policies
04 Caveats & Extensions CONCLUSION Caution is needed in advancing straightforward conclusions based on the scenarios assumptions, particularly on: - 50 % of substrates used in biogas production, - (partial) substitution of fossil fuels in power generation, - several adjustments required in the infrastructure of electricity generation, and - public policies to help the market develop. Given the relevance of private investments in the biogas sector, it would be important to complement these results with a private cost-benefit analysis to provide an additional dimension of feasibility in the analysis of the biogas scenarios.
THANK YOU VERY MUCH Instituto Interdisciplinario de Econom a Pol tica Av. C rdoba 2122 - 1 y 2 piso (C1120 AAQ) Ciudad Aut noma de Buenos Aires, Argentina +54 11 5285-6578 | www.iiep.economicas.uba.ar @iiep_oficial




![Halal_Chicken_from_Brazil-_Ensuring_Quality_and_Authenticity[1]](/thumb/86918/halal-chicken-from-brazil-ensuring-quality-and-authenticity-1.jpg)


