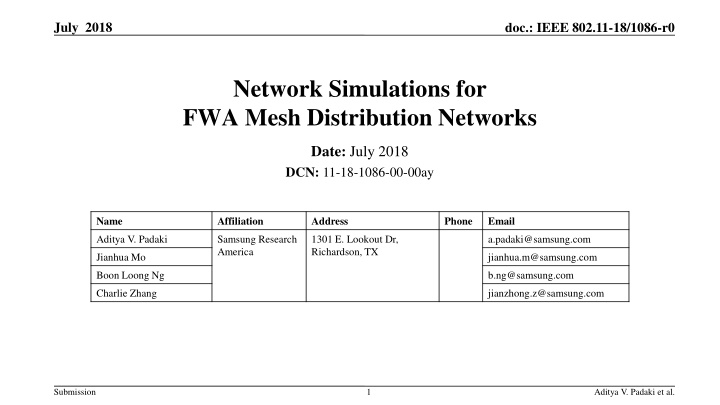
Network Simulations for FWA Mesh Distribution Networks
In July 2018, a study on IEEE 802.11-18/1086-r0 was conducted, focusing on network layout, system-level parameters, and simulation results for Fixed Wireless Access (FWA) mesh distribution networks. The study delves into urban grid layouts, antenna parameters, network modeling, topology formulation, and network throughput analysis. Various simulations were performed to analyze network performance, including downlink scenarios, CN distribution, and user perceived throughput metrics. Detailed findings and conclusions based on the study's variables and parameters are presented in this document.

Download Presentation

Please find below an Image/Link to download the presentation.
The content on the website is provided AS IS for your information and personal use only. It may not be sold, licensed, or shared on other websites without obtaining consent from the author.If you encounter any issues during the download, it is possible that the publisher has removed the file from their server.
You are allowed to download the files provided on this website for personal or commercial use, subject to the condition that they are used lawfully. All files are the property of their respective owners.
The content on the website is provided AS IS for your information and personal use only. It may not be sold, licensed, or shared on other websites without obtaining consent from the author.
E N D
Presentation Transcript
July 2018 doc.: IEEE 802.11-18/1086-r0 Network Simulations for FWA Mesh Distribution Networks Date: July 2018 DCN: 11-18-1086-00-00ay Name Affiliation Address Phone Email Aditya V. Padaki Samsung Research America 1301 E. Lookout Dr, Richardson, TX a.padaki@samsung.com Jianhua Mo jianhua.m@samsung.com Boon Loong Ng b.ng@samsung.com Charlie Zhang jianzhong.z@samsung.com Submission 1 Aditya V. Padaki et al.
July 2018 doc.: IEEE 802.11-18/1086-r0 Overview Network Layout System Level Parameters Network Modeling Simulation Results Submission 2 Aditya V. Padaki et al.
July 2018 doc.: IEEE 802.11-18/1086-r0 Network Layout Urban Grid Layout o 25 DN nodes with wrap around o Inter DN distance varied o Number of Fiber DN nodes varied Street Width = 20m CN Distribution o CNs distributed uniformly at random along the pavement Submission 3 Aditya V. Padaki et al.
July 2018 doc.: IEEE 802.11-18/1086-r0 System Level Parameters This simulation study is downlink only Variables Grid Parameters Variables Antenna Parameters Rectangular urban grid 6m Network Layout DN height Total 25. Simulations with 1, 3, 5, 9 and 25 Fiber DNs 1.5m CN height Number of DNs 43 dBm DN EIRP Block size: 125m 216.5m Also, 50m 85m, 250m 433m for some results Distance between DNs DN array configuration Number of elements: 128 (16H 8V). Max. Gain ~ 29 dBi Minimum 1, Maximum 5 Number of hops CN array configuration Number of elements: 32 (8H 4V). Max. Gain ~ 23 dBi CNs distributed uniformly at random along the pavement CN distribution PDF/CDF of DN SINR, PDF/CDF of CN SINR, user perceived throughput (based on 11ad mapping) Metrics FTP traffic model 3 [1] (Poisson arrival process, File size 0.5 Mbytes) Traffic Model 3GPP Urban Micro Street Canyon Model [2] Channel Model Submission 4 Aditya V. Padaki et al.
July 2018 doc.: IEEE 802.11-18/1086-r0 Network Modeling Topology formulation o Breadth first search algorithm to assign tiers to the DNs o Tier 1: Fiber DNs, Tier 2: DNs with 1 hop to Fiber DNs, and so on. DN-DN and DN-CN transmission on orthogonal time slots DN TX DN RX CN TDD polarity assignment based on Tiers Submission 5 Aditya V. Padaki et al.
July 2018 doc.: IEEE 802.11-18/1086-r0 Network Throughput Number of DNs: 25 Number of CNs: 500 Arrival Rate: 10 Msgs/sec per CN EIRP: 43 dBm Grid Size:125m 216.5m Transmission Interval: 1ms File size: 0.5 Mbyte per Msg SINR mapped to 11ad MCS to compute throughput For our network configuration, 5 Fiber DNs are sufficient to achieve maximum network throughput Submission 6 Aditya V. Padaki et al.
July 2018 doc.: IEEE 802.11-18/1086-r0 User Perceived Throughput (UPT) User perceived throughput (during active time), defined as the size of a burst divided by the time between the arrival of the first packet of a burst and the reception of the last packet of the burst Tier 1 links are bottleneck o UPT drastically reduces with number of hops o This is irrespective of resource utilization of links for relay DNs as links of fiber DNs form bottleneck Submission 7 Aditya V. Padaki et al.
July 2018 doc.: IEEE 802.11-18/1086-r0 UPT vs Number of Fiber DNs Average perceived throughput of a user defined as the average from all perceived throughput for all bursts intended for this user Tail (Head) perceived throughput defined as the worst 5% (best 5%) perceived throughput among all bursts intended for a user Note: As number of hops increases (Fiber DN=1), across the network only those connected to Fiber DNs get very high UPT. Rest get disproportionately low UPT as links from Fiber DNs have to serve most of the traffic. Thus, average UPT is skewed as seen from the result (95 percentile UPT is lower than average UPT) Submission 8 Aditya V. Padaki et al.
July 2018 doc.: IEEE 802.11-18/1086-r0 Varying Arrival Rates Message arrival rate varied 5 Fiber DNs Two Tiers* o Tier 1: Fiber DNs o Tier 2: One hop to Fiber DN We study the network throughput and UPT for various arrival rates Clearly, fiber DN links are bottlenecks *Note: Tier 3, 4, etc would be nodes for 2, 3, etc hops to nearest Fiber DN. In this network, there are none. Submission 9 Aditya V. Padaki et al.
July 2018 doc.: IEEE 802.11-18/1086-r0 UPT and Network Throughput with Arrival Rate UPT (a measure of latency) decreases steeply with arrival rate even if network not saturated Tier 1 links are the bottleneck (saturate at 15 Msgs/sec) this increases latency (msgs wait longer in buffer) Submission 10 Aditya V. Padaki et al.
July 2018 doc.: IEEE 802.11-18/1086-r0 CDF of Instantaneous DN-DN link SINR/SNR with varying Grid Size Submission 11 Aditya V. Padaki et al.
July 2018 doc.: IEEE 802.11-18/1086-r0 Summary For our network configuration, 5 Fiber DNs are sufficient to achieve maximum network throughput Links originating from Fiber DNs are bottlenecks o This bottleneck reduces UPT for CNs connected to Relay DNs o This is irrespective of Relay DN link resource utilization UPT (a measure of latency) decreases steeply with arrival rate even if network not saturated Simulations indicate mesh networks could be interference limited o Possibly depends on the network layout of simulation, Tx Power o This can potentially be overcome by scheduling, power control, etc. Opening up avenues for potentially more simulation studies and calibration o Provide insights to network design and deployment strategies Submission 12 Aditya V. Padaki et al.
July 2018 doc.: IEEE 802.11-18/1086-r0 References 1. Further advancements for E-UTRA physical layer aspects, 3GPP TR 36.814 V9.2.0 (2017-03), Available: http://www.3gpp.org/ftp/Specs/archive/36_series/36.814/36814-920.zip 2. Study on channel model for frequencies from 0.5 to 100 GHz, 3GPP TR 38.901 V15.0.0 (2018-06), Available: http://www.3gpp.org/ftp/Specs/archive/38_series/38.901/38901-f00.zip Submission 13 Aditya V. Padaki et al.