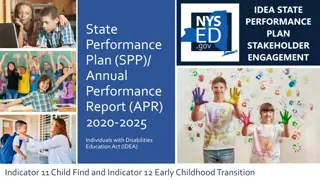
New Requirements for Stakeholder Engagement in SPP/APR Implementation
Learn about the new requirements for stakeholder engagement in the State Performance Plan/Annual Performance Report (SPP/APR) implementation, including expanding advisory group membership, seeking broader parental input, and documenting the engagement process. Discover how states can enhance stakeholder involvement in target setting, data analysis, improvement strategies, and progress evaluation.

Download Presentation

Please find below an Image/Link to download the presentation.
The content on the website is provided AS IS for your information and personal use only. It may not be sold, licensed, or shared on other websites without obtaining consent from the author. If you encounter any issues during the download, it is possible that the publisher has removed the file from their server.
You are allowed to download the files provided on this website for personal or commercial use, subject to the condition that they are used lawfully. All files are the property of their respective owners.
The content on the website is provided AS IS for your information and personal use only. It may not be sold, licensed, or shared on other websites without obtaining consent from the author.
E N D
Presentation Transcript
SPP.APR Stakeholder Meeting #3 Indicators 6, 7, 15 and 16 August 11, 2021
The presentation will begin shortly . . . Please sign-in to the event by using the following URL or clicking on the link in the chat box to your right: https://tinyurl.com/2r5xtytc Thank you!
What Will Stakeholder Engagement Look Like With the New SPP/APR? Making Requirements a Reality! There are new requirements for including stakeholders in the State Performance Plan/Annual Performance Report (SPP/APR) Package starting February 1, 2022. These requirements include: Expanding the membership of the advisory group(s) that will inform the development of the SPP/APR and expanding the type of advice states should seek from their stakeholders; Include a broader group of parents, including those on the state advisory panel or other advisory groups, advocates, and parents not typically associated with any of the parent organizations, in the development of the SPP/APR; Broadening the advice they seek from stakeholders to include not only advice about target setting but advice about data analysis, developing improvement strategies, and evaluating progress; and Documenting the stakeholder engagement process. States need to provide information about state strategies for soliciting stakeholder feedback and informing stakeholders of decisions the state made as well as plans for making the results of target setting, data analysis, development of improvement strategies, and evaluation available to the public.
Agenda / Objectives Review trend data Seek input from stakeholders in setting the targets for indicators required for SPP.APR Federal Fiscal Years (FFY) 2020-2025. Results indicator Preschool Least Restrictive Environment 6A, 6B and 6C Result indicator Preschool Outcomes 7A, 7B and 7C Compliance indicator 15 Resolution Sessions Compliance indicator 16 Mediation
Most Common Preschool Educational Environments in West Virginia LEAST Restrictive Regular Early Childhood program: most Special Education services are push-in Regular Early Childhood program: most Special Education services are pull-out Special Education Program separate class 6B 6C 6A Home Service Provider Location MOST Restrictive 5
Indicator 6 Education Environments - Preschool Age - Least Restrictive Environment (LRE) Data source for SPP.APR is the annual December One Child Count. Starting with School Year 2020-2021 students with an IEP that were age five in Kindergarten were required to have a school age LRE code. Beginning with SPP.APR 2020 these students are included into indicator 5 calculations instead of indicator 6. This change decreases the total number of students identified as preschool age. For this indicator, Preschool Age is defined as students with an IEP ages three through five that have not started Kindergarten.
Indicator 6A Indicator 6A = The number of preschool age students with an IEP with the majority of their service within in a regular early childhood program (LRE=W/Y) divided by all preschool age students with an IEP. The most recent school year that was not impacted by COVID-19 was SY 2019-2020 for this indicator. The actual data for that year was reported in FFY2019 as 39.60% which is the proposed baseline. The targets for FFY2020-FFY2025 must be higher than the baseline. The proposed WV targets on which your feedback is needed are listed on the following graph.
Indicator 6A Proposed Targets FFY2020-2025 70.00% 60.00% 50.00% 42.50% 42.00% 41.50% 41.00% 40.50% 40.00% 39.60% 40.00% 34.18% 32.80% 32.55% 32.30% 32.30% 30.00% 20.00% 10.00% 0.00% FFY2017 FFY2018 FFY2019 FFY2020 FFY2021 FFY2022 FFY2023 FFY2024 FFY2025 TARGET ACTUAL Linear (ACTUAL)
Indicator 6B Indicator 6B = The number of preschool age students with an IEP served in a separate class, separate school or residential facility placement (LRE=M, N and P) divided by all preschool age students with an IEP. The most recent school year that was not impacted by COVID-19 was SY 2019-2020 for this indicator. The actual data for that year was reported in FFY2019 as 9.74% which is the proposed baseline. The targets for FFY2020-FFY2025 must be lower than the baseline. The proposed WV targets on which your feedback is needed are listed on the following graph.
Indicator 6B Proposed Targets FFY2020-2025 14.00% 12.00% 10.30% 10.30% 10.20% 9.74% 9.70% 9.60% 10.00% 9.50% 9.40% 9.30% 9.20% 8.53% 8.39% 8.00% 6.00% 4.00% 2.00% 0.00% FFY2017 FFY2018 FFY2019 FFY2020 FFY2021 FFY2022 FFY2023 FFY2024 FFY2025 TARGET ACTUAL Linear (ACTUAL)
Indicator 6C is a New Indicator as of FFY2020 Indicator 6C = The number of preschool age students with an IEP served in a home placement (LRE=R) divided by all preschool age students with an IEP. This will be the first time this indicator will be collected and reported. Since it is a new indicator, the proposed baseline will be anticipated FFY2020 of 2.26%. Targets beginning with FFY2021 will need to be lower than the baseline. The proposed WV targets on which your feedback is needed are listed on the following graph.
Indicator 6C Targets FFY2020-2025 TARGET ACTUAL 2.27% 2.26% 2.26% 2.26% 2.25% 2.25% 2.24% 2.24% 2.23% 2.23% 2.22% 2.22% 2.21% 2.21% 2.20% 2.19% 2.18% FFY2020 FFY2021 FFY2022 FFY2023 FFY2024 FFY2025
Indicator 7 Preschool Outcomes West Virginia uses the Childhood Outcomes Survey. Percent of preschool children aged 3 through 5 with IEPs who demonstrate improved: 7A Positive social-emotional skills (including social relationships); 7B Acquisition and use of knowledge and skills (including early language/communication and early literacy); and 7C Use of appropriate behaviors to meet their needs. The most recent school year that was not impacted by COVID-19 was SY 2018-2019 for this indicator. The actual data for that year was reported in FFY2019 which is the proposed baseline year.
Indicator 7A1 Positive social-emotional skills Summary Statement 7A1: The percentage of pre-school students with an IEP who substantially increased their rate of growth by the time they exited the pre-school program. The baseline data for this statement is 84.47%. The targets must be higher than the baseline. See the proposed FFY2020-2025 targets on the graph. Indicator 7A1 88.00% 87.00% 86.50% 86.00% 85.50% 86.00% 84.47% 85.00% 84.50% 84.00% 82.50% 81.44% 82.00% 79.50% 80.00% 79.00% 78.50% 78.00% 76.00% 74.00% FFY2017 FFY2018 FFY2019 FFY2020 FFY2021 FFY2022 FFY2023 FFY2024 FFY2025 TARGET ACTUAL
TARGET ACTUAL 88.0% 87.00% 86.0% 86.50% 86.00% 85.50% 85.00% 84.0% 84.50% 84.47% 82.0% 82.50% 81.44% 80.0% 79.50% 79.00% 78.0% 78.50% 76.0% 74.0% FFY2017 FFY2018 FFY2019 FFY2020 FFY2021 FFY2022 FFY2023 FFY2024 FFY2025
Indicator 7A2 Positive social- emotional skills Targets FFY2020- 2025 Summary Statement 7A2: The percentage of preschool children with an IEP who were functioning within age expectations by the time they exited the pre-school program. The baseline data for this statement is 64.31. The targets must be higher than the baseline. See the proposed FFY2020-2025 targets on the graph. Indicator 7A2 69.00% 68.00% 68.00% 68.00% 67.50% 67.00% 66.00% 64.31% 64.80% 64.70% 65.00% 64.60% 64.50% 64.34% 64.40% 64.32% 63.32% 64.00% 63.00% 62.00% 61.00% 60.00% FFY2017 FFY2018 FFY2019 FFY2020 FFY2021 FFY2022 FFY2023 FFY2024 FFY2025 TARGET ACTUAL Linear (ACTUAL)
TARGET ACTUAL Linear (ACTUAL) 69.0% 68.0% 68.00% 68.00% 67.50% 67.0% 66.0% 65.0% 64.80% 64.70% 64.60% 64.50% 64.0% 64.40% 64.34% 64.32% 64.31% 63.0% 63.32% 62.0% 61.0% 60.0% FFY2017 FFY2018 FFY2019 FFY2020 FFY2021 FFY2022 FFY2023 FFY2024 FFY2025
Indicator 7B1 Acquisition and use of knowledge and skills Targets FFY2020-2025 Summary Statement 7B1: The percentage of pre-school students with an IEP who substantially increased their rate of growth by the time they turned exited the pre-school program. The baseline data for this statement is 83.50%. The targets must be higher than the baseline. See the proposed FFY2020-2025 targets on the graph. Indicator 7B1 90.00% 88.00% 86.00% 85.50% 86.00% 85.00% 84.50% 84.00% 83.50% 83.51% 84.00% 82.98% 82.05% 82.00% 79.50% 80.00% 79.00% 78.50% 78.00% 76.00% 74.00% 72.00% FFY2017 FFY2018 FFY2019 FFY2020 FFY2021 FFY2022 FFY2023 FFY2024 FFY2025 TARGET ACTUAL Linear (ACTUAL)
TARGET ACTUAL Linear (ACTUAL) 90.0% 88.0% 86.0% 86.00% 85.50% 85.00% 84.0% 84.50% 84.00% 83.51% 83.50% 82.98% 82.0% 82.05% 80.0% 79.50% 79.00% 78.0% 78.50% 76.0% 74.0% 72.0% FFY2017 FFY2018 FFY2019 FFY2020 FFY2021 FFY2022 FFY2023 FFY2024 FFY2025
Indicator 7B2 Acquisition and use of knowledge and skills Targets FFY2020-2025 Summary Statement 7B2: The percentage of preschool children with an IEP who were functioning within age expectations by the time they exited the preschool program. The baseline data for this statement is 62.91%. The targets must be higher than the baseline. See the proposed FFY2020-2025 targets on the graph. Indicator 7B2 65.00% 63.50% 64.00% 64.00% 64.00% 63.50% 63.40% 63.30% 62.91% 63.20% 63.10% 63.00% 62.92% 63.00% 62.00% 61.51% 61.00% 60.00% 59.00% 58.00% FFY2017 FFY2018 FFY2019 FFY2020 FFY2021 FFY2022 FFY2023 FFY2024 FFY2025 TARGET ACTUAL Linear (ACTUAL)
TARGET ACTUAL Linear (ACTUAL) 65.0% 64.0% 64.00% 64.00% 63.50% 63.50% 63.40% 63.0% 63.30% 63.20% 63.10% 63.00% 62.92% 62.91% 62.0% 61.51% 61.0% 60.0% 59.0% 58.0% FFY2017 FFY2018 FFY2019 FFY2020 FFY2021 FFY2022 FFY2023 FFY2024 FFY2025
Indicator 7C1 Use of appropriate behaviors to meet their needs Targets FFY2020-2025 Summary Statement 7C1: The percentage of pre-school students with an IEP who substantially increased their rate of growth by the time they turned exited the pre-school program. The baseline data for this statement is 86.28%. The targets must be higher than the baseline. See the proposed FFY2020-2025 targets on the graph. Indicator 7C1 94.00% 92.00% 90.00% 88.80% 88.30% 87.80% 87.30% 88.00% 86.80% 86.29% 86.28% 85.57% 86.00% 84.48% 84.00% 82.00% 80.50% 80.00% 79.50% 80.00% 78.00% 76.00% 74.00% 72.00% FFY2017 FFY2018 FFY2019 FFY2020 FFY2021 FFY2022 FFY2023 FFY2024 FFY2025 TARGET ACTUAL Linear (ACTUAL)
TARGET ACTUAL Linear (ACTUAL) 94.0% 92.0% 90.0% 88.0% 88.80% 88.30% 87.80% 87.30% 86.0% 86.80% 86.29% 86.28% 85.57% 84.0% 84.48% 82.0% 80.0% 80.50% 80.00% 79.50% 78.0% 76.0% 74.0% 72.0% FFY2017 FFY2018 FFY2019 FFY2020 FFY2021 FFY2022 FFY2023 FFY2024 FFY2025
Indicator 7C2 Use of appropriate behaviors to meet their needs Targets FFY2020-2025 Summary Statement 7C2: The percentage of preschool children with an IEP who were functioning within age expectations by the time they exited the preschool program. The baseline data for this statement is 74.90%. The targets must be higher than the baseline. See the proposed FFY2020-2025 targets on the graph. Indicator 7C2 81.00% 80.00% 80.00% 79.00% 79.00% 78.50% 78.00% 77.00% 74.90% 76.00% 75.40% 75.30% 75.20% 75.10% 75.00% 74.91% 74.41% 75.00% 73.72% 74.00% 73.00% 72.00% 71.00% 70.00% FFY2017 FFY2018 FFY2019 FFY2020 FFY2021 FFY2022 FFY2023 FFY2024 FFY2025 TARGET ACTUAL Linear (ACTUAL)
TARGET ACTUAL Linear (ACTUAL) 81.0% 80.0% 80.00% 79.0% 79.00% 78.0% 78.50% 77.0% 76.0% 75.0% 75.40% 75.30% 75.20% 75.10% 75.00% 74.91% 74.90% 74.0% 74.41% 73.72% 73.0% 72.0% 71.0% 70.0% FFY2017 FFY2018 FFY2019 FFY2020 FFY2021 FFY2022 FFY2023 FFY2024 FFY2025
Indicators 15 and 16 Indicator 15 The percentage of hearing requests that went to resolution sessions that were resolved through resolution session settlement agreements. The baseline data for this indicator was 75% reported in FFY 2019. The proposed target for this indicator is 76% for each year FFY2020-2025. Indicator 16 Percentage of mediations held that resulted in mediation agreements. The baseline data for this indicator was 57.14% reported in FFY 2018. The proposed target for this indicator is 75% for each year FFY2020-2025.
Survey and Feedback: Please complete the survey at the following URL. https://www.surveymonkey.com/r/Aug11GV8ZMLB Susan Beck, Director Office of Federal Programs and Support Special Education Services 304-558-2696 sbeck@k12.wv.us