Noise Pollution in 4th Year
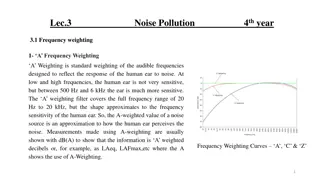
Noise pollution is defined as unwanted sound that can interfere with speech, damage hearing, and disrupt the environment. Learn about sound waves, frequency bands, and sound pressure in this informative lecture.

Download Presentation

Please find below an Image/Link to download the presentation.
The content on the website is provided AS IS for your information and personal use only. It may not be sold, licensed, or shared on other websites without obtaining consent from the author.If you encounter any issues during the download, it is possible that the publisher has removed the file from their server.
You are allowed to download the files provided on this website for personal or commercial use, subject to the condition that they are used lawfully. All files are the property of their respective owners.
The content on the website is provided AS IS for your information and personal use only. It may not be sold, licensed, or shared on other websites without obtaining consent from the author.
E N D
Presentation Transcript
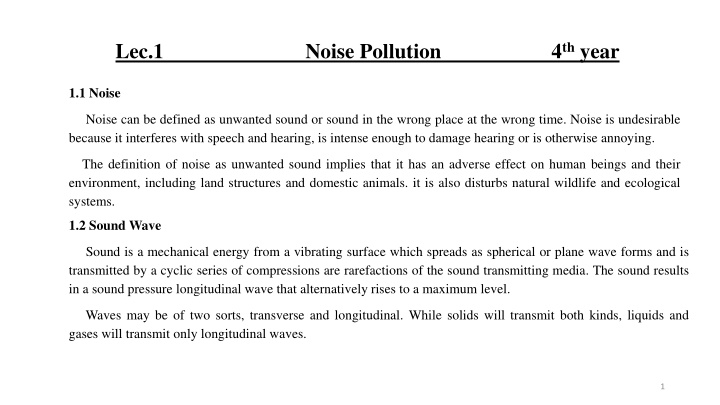
Lec.1 Noise Pollution 4thyear 1.1 Noise Noise can be defined as unwanted sound or sound in the wrong place at the wrong time. Noise is undesirable because it interferes with speech and hearing, is intense enough to damage hearing or is otherwise annoying. The definition of noise as unwanted sound implies that it has an adverse effect on human beings and their environment, including land structures and domestic animals. it is also disturbs natural wildlife and ecological systems. 1.2 Sound Wave Sound is a mechanical energy from a vibrating surface which spreads as spherical or plane wave forms and is transmitted by a cyclic series of compressions are rarefactions of the sound transmitting media. The sound results in a sound pressure longitudinal wave that alternatively rises to a maximum level. Waves may be of two sorts, transverse and longitudinal. While solids will transmit both kinds, liquids and gases will transmit only longitudinal waves. 1
Sound waves are usually shown as if they were for instance on an oscilloscope (transverse compression) and drops to a minimum level (rarefaction). On striking the ear, it may be heard as sound waves. Sound pressure variation of a sine wave showing the phase relationship between pressure and particle displacement. Amplitude (A) : the maximum or minimum pressure. Wavelength ( ) : the distance between successive troughs or crests. Period (T) : the time lapse between successive peaks. T Frequency (f) : the number of complete pressure variations or cycles/second. Relationship: ? =? ?? =? ? 2
The speed of propagation (c) of sound in air is 340 m/s, at 20oC and 1 atmosphere pressure. At other temperatures, it may be calculated by using the formula: ? = ??.?? ??? + ????. Sound / noise results from periodic disturbances of the air at room temperature are propagated in air at a speed of approximately 340m/s. In water (1500m/s) and steel (5000m/s), the speed is much greater. 1.3 Octave Bands Most sound sources contain energy over a wide range of frequencies. For measurements, analysis and specification of sound, the frequency range is divided into sections called the frequency bands. One command standard division into 10 octave bands identified by their center frequencies: 31.5, 63 , 125 , 250 , 500 , 1000 , 2000 , 4000 , 8000 and 16000 Hz. The frequency of these 10 octave bands is 22.4 22400 Hz. Furthermore, there are 4 other octave bands covering the infrasonic range of frequency with centre frequencies of 2 , 4, 8 and 16Hz, the frequency range of these 4 octave bands is 1.41 22.4 Hz. 3
In each octave band, the upper limiting frequency fU is exactly twice the lower limiting frequency fL. The centre frequency fC of each octave band defined as: ?C= ?? ?? = 2 ?? Octave bands Hz Octave centers ? ?C Hz fL fU 1.41 2.82 2 2.82 5.62 4 5.62 11.2 8 11.2 22,4 16 22,4 44.7 31.5 44.7 89.1 63 89.1 178 125 178 355 250 355 708 500 708 1410 1000 1410 2820 2000 2820 5620 4000 5620 11200 8000 11200 22400 16000 4
1.4 Sound Pressure The sound is caused by rapid fluctuations in air pressure; a sound wave consists of pressures above and below the normal pressure in the air. The smallest sound pressure that an average young adult can detect corresponds to a sound pressure of 20 pa at a frequency 1000Hz. This value of sound pressure is internationally accepted as the threshold of hearing. 1.5 Sound Intensity and Sound Power The sound power flowing per unit area, in a given direction, measured over an area perpendicular to the direction of flow, its units are W/m2, Symbolically, the sound intensity is then ? =? ? Where I= sound intensity (W/m2) W= acoustical sound power of the source (W) A= surface area (m2), for a point source, the areas over which sound power distributes are concentric spheres with an increasing radius and therefore an increasing area of 4??2 5
also, it can used the equation below to calculate Sound Intensity: ? =?2 ?? Where P= mean square sound pressure (Pa2) = density of medium (kg/m3) c= speed of sound (m/sec) the term ( c) is known as the acoustic impedance ( is a basically a measure of the resistance a fluid or material medium gives to the propagating of sound waves, it is the product of the speed of sound in the medium and its density), in the air ?? =429 rayls (rayl =kg/m2.sec). Material Density Speed (ms-1) of sound Acoustic (kgm-2s-1x10⁶) impedance (kgm-3) Air 1.3 330 0.000429 Water 1000 1450 1.50 Bone (average) 1500 4000 6.00 6
1.6 What is a decibel? The decibel (dB) is used to measure sound level, but it is also widely used in electronics, signals and communication. The dB is a logarithmic way of describing a ratio. The ratio may be power, sound pressure, voltage or intensity or several other things The reference value in sound levels corresponds to minimum audible sound to the average human ear at 1000Hz. 7
1.7 Sound Pressure Level, Sound Intensity Level, Sound Power Level Sound Pressure level measured on a dB scale: 2 ???? ?? = 20log???? ??? = 10log ?? Where SPL= Sound Pressure Level (dB) Prms= Root mean square sound pressure (Pa) Po= Reference value (20 10-6 Pa) ? ??? = 10log ?? Where SIL= Sound Intensity Level (dB) I = Sound intensity (W/m2) Io= Reference value (10-12 W/m2) 8
??? = 10log? ?? Where SWL=Sound Power Level (dB) W= Sound power (W) Wo= Reference value (10-12 W) 1.8 Some Common Sounds Table below illustrate sound pressure and sound pressure level for some common sound . Notes: A change in level of <1 dB is not predictable A change in level of 3 dB is just predictable A change in level of 5 dB is clearly predictable A change in level of 10 dB is twice as load Zero dB level does not mean an absence of sound , it merely implies that the level is equal to the reference value. 9
1.9 Addition of Sound Pressure Level and Sound Power Level In most industrial environments, sound is emitted from than one source or at different frequencies, so, the cumulative or overall or total SPL can be calculated from this equation: ? ????10 ????= 10 ??? ?=1 10 When many sources have the same SPL, this equation can be used: Increase in dB level =10 log (N) Where N=Number of sources and total SWL can be calculated by: ? ????10 ????= 10 ??? ?=1 10 10


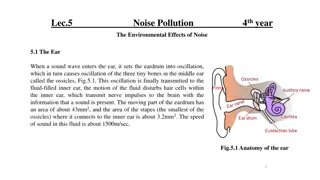
 of sound in air is 340 m/s, at")