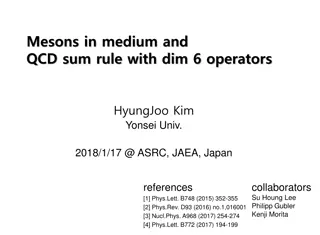
Non-Perturbative Effects on Heavy Quark Radiative Energy Loss
This study delves into non-perturbative effects impacting the radiative energy loss of heavy quarks, exploring their implications in strongly coupled QGP and high-energy parton interactions. The research presents a T-matrix approach for energy loss and investigates various scenarios with different non-perturbative effects. By analyzing the spectral functions and medium effects, the study aims to enhance the understanding of these complex phenomena.
Download Presentation

Please find below an Image/Link to download the presentation.
The content on the website is provided AS IS for your information and personal use only. It may not be sold, licensed, or shared on other websites without obtaining consent from the author.If you encounter any issues during the download, it is possible that the publisher has removed the file from their server.
You are allowed to download the files provided on this website for personal or commercial use, subject to the condition that they are used lawfully. All files are the property of their respective owners.
The content on the website is provided AS IS for your information and personal use only. It may not be sold, licensed, or shared on other websites without obtaining consent from the author.
E N D
Presentation Transcript
College of Health Sciences & Professional Studies Scorecard Analysis Fall 2014
College of HS & PS Scorecard Program Sustainability and Vitality Student Success and Outcomes Financial Effectiveness Department Cr edi t Ho urs Instruc tional Staffin g Instruc tional Produc tivity Degr ees Awa rded Reve nue per FTE NMU Rete ntion Gradu ation Rate Compe nsation per SCH Enroll ment Name Type Clinical Sciences APP LIED Criminal Justice APP LIED APP LIED Education Engineerin g Technolog y APP LIED Health/Ph y Ed/Rec/N utrition APP LIED APP LIED Nursing - - Tech/Occ upational Studies APP LIED -
Total Enrollment Headcount Comparison CoHS & PS Fall 2009- 2012 Average 235 41 4 581 337 1 558 429 417 449 12 143 35 Fall 2013 % Change Indicator Department Difference 5% tolerance Engineering Technology Sociology & Anthropology Modern Languages and Lit Nursing Educatn/Leadership/Public Serv Speech, Language & Hearing Sci Tech/Occupational Studies Clinical Sciences Criminal Justice Health & Human Performance Health Science/Prof Studies Social Work Practical Nursing Coll Health Sci/Prof Studies Total 237 0 3 502 266 0 454 394 363 461 30 142 73 2 0.9% -100.0% -29.4% -13.6% -21.0% -100.0% -18.6% -8.2% -12.9% 2.6% 144.9% -0.9% 110.1% -41 -1 -79 -71 -1 -104 -35 -54 12 18 -1 38 2,925 3,242 -317 -9.8%
CHSPS Enrollment by 1st Major 700 600 500 Number of Students 400 300 200 100 0 CJ CS ED ENGT NE PE PN SW TOS F10 452 418 565 230 603 477 53 128 615 F11 456 455 572 231 620 477 131 583 F12 423 430 543 236 604 471 25 151 557 F13 436 413 521 243 566 480 61 163 477 F14 377 403 622 237 525 492 73 142 454 F10 F11 F12 F13 F14
CJ Program Enrollments 450 400 350 300 Dept Code CMGT Criminal Justice Management 250 CJ CRIM Criminal Justice CJ LAWE Law Enforcement 200 CJ LOSS Loss Prevention Management 150 CJ SAFE Advanced Law Enforcement 100 50 0 Total Major Total Major Total Major Total Major Total Major F10 F11 F12 F13 F14
Clinical Science 120 100 80 60 40 20 0 CLHS CLLS CLMG CLNA CLSA CLSC CLTN CLT CLTN DIAG PRAD PRES PSUR RADI RESP SCIE SLHS SURG F10 Total Major F11 Total Major F12 Total Major F13 Total Major F14 Total Major
School of Education, Leadership & Public Service 120 100 80 60 40 20 0 EDAEEDASEDBREDBT EDCE EDIN EDLD EDLE EDLL EDPDEDSA EDSC EDSI EDSP EEED EEEI EEEN EEIS EELAEEMAEEMI EEPV EESS PUBASEED SEEI SEIS SEMI SEPV F10 Total Major F11 Total Major F12 Total Major F13 Total Major F14 Total Major
ENGT 120 100 80 60 40 20 0 CNCO CNCT ELMT ELTC ENGD ETEC ETRN INDT ITEC MECE SEIT TECH F10 Total Major F11 Total Major F12 Total Major F13 Total Major F14 Total Major
Nursing BSN & MSN 700 600 500 400 300 200 100 0 Total Major Total Major Total Major Total Major Total Major F10 F11 F12 F13 F14 NE NFNP Family Nurse Practitioner 15 20 17 17 23 NE NURS Nursing 588 600 587 549 502 NE NFNP Family Nurse Practitioner NE NURS Nursing
Students Admitted and Enrolled in the BSN Program 249 220 215 210 206 F10 F11 F12 F13 F14
Practical Nursing 45 40 35 30 25 20 15 10 5 0 Total Major Total Major Total Major Total Major Total Major F10 F11 F12 F13 F14 PN LPN Practical Nursing PN PLPN Pre-Practical Nursing
School of Health & Human Performance 120 100 80 60 40 20 0 ATRA CMHL EXER HLTM ORLM PECO PEED SEHL SEPE SPOR WFIR F10 Total Major 90 38 23 67 96 38 1 6 36 82 F11 Total Major 104 50 21 66 89 35 1 4 37 70 F12 Total Major 99 47 30 64 78 32 40 81 F13 Total Major 107 38 34 68 80 36 26 86 5 F14 Total Major 105 41 31 78 91 33 23 78 12 F10 Total Major F11 Total Major F12 Total Major F13 Total Major F14 Total Major
SW SOCW Social Work 163 151 142 131 128 Total Major Total Major Total Major Total Major Total Major F10 F11 F12 F13 F14 SW SOCW Social Work 128 131 151 163 142
Technology & Occupational Science 140 120 100 80 60 40 20 0 AUTO AVIA BUIL CLIM COLL CONT COSI COSM ELIN FOOD HEAT HMGT INDM WELD F10 Total Major F11 Total Major F12 Total Major F13 Total Major F14 Total Major
Total Credit Hour Comparison Fall 2010-2013 Average Difference % Change Indicator Department Fall 2014 5% tolerance Engineering Technology 2,287 2,248 39 1.7% Sociology & Anthropology 0 0 0 0.0% - Military Science 255 259 -4 -1.5% Educatn/Leadership/Public Serv 3,414 3,409 5 0.1% Nursing 2,783 2,824 -41 -1.5% Speech, Language & Hearing Sci 0 0 0 0.0% - Tech/Occupational Studies 5,036 5,962 -926 -15.5% Clinical Sciences 2,972 2,962 10 0.3% Criminal Justice 2,847 3,528 -681 -19.3% Health & Human Performance 7,765 7,809 -44 -0.6% Social Work 1,248 1,234 14 1.1% Coll Health Sci/Prof Studies Total 29,089 30,514 -1,425 -4.7%
CHSPS SCH by Department 10000 9000 8000 7000 6000 5000 4000 3000 2000 1000 0 CJ CS ED ENGT NE PE PN SW TOS F10 Total SCH F11 Total SCH F12 Total SCH F13 Total SCH F14 Total SCH
Instructional Staffing FTETF Fall 2010-2012 Average Department Type Fall 2013 Difference % Change Indicator Clinical Sciences APPLIED 13.2 12.7 0.5 3.9% Criminal Justice APPLIED 11.1 10.2 0.9 8.8% Education APPLIED 22.4 20.3 2.1 10.3% Engineering Technology APPLIED 8.9 8.9 0.0 0.0% Health/Phy Ed/Rec/Nutrition APPLIED 30.1 27.7 2.4 8.7% Nursing APPLIED 21.3 21.6 -0.3 -1.4% Tech/Occupational Studies APPLIED 21.7 22.3 -0.6 -2.7%
SCH/FTETF Indicator (Compared against College of Health Sciences and Professional Studies average of 501.4) Indicator (Compared against dept average) Fall 2010- 2012 Average Fall 2013 Difference % Department Type Change Clinical Sciences APPLIED 464.2 459.5 4.7 1.0% Criminal Justice APPLIED 768.5 807.1 -38.6 -4.8% Education APPLIED 378.9 442.1 -63.2 -14.3% Engineering Technology APPLIED 514.6 497.4 17.2 3.5% Health/Phy Ed/Rec/Nutrition APPLIED 581.9 631.5 -49.6 -7.9% Nursing APPLIED 302.4 320.2 -17.8 -5.6% Tech/Occupational Studies APPLIED 499.4 545.2 -45.8 -8.4% College of Health Sciences and Professional Studies Average DEGREE DEPTS 501.4 529 -27.6 -5.2% N/A
SCH/FTEFT 1000 900 800 700 600 500 400 300 200 100 0 CJ CLS ED ENGT NE PE SO TOS 2012 SCH/FTETF 796 448 407 482 307 604 931 530 2013 SCH/FTETF 769 464 379 515 302 582 850 499 2012 SCH/FTETF 2013 SCH/FTETF
2ndYear (3rdsemester) Retention UG (AD & Bac) Department Retained in same major Retained at NMU Average Cohort 2010-2012 % Returned Next Fall Average Cohort 2010-2012 % Returned Next Fall 2012 Cohort % Returned Fall 2013 2012 Cohort % Returned Fall 2013 Name Type Enrollment Indicator Indicator Clinical Sciences APPLIED 54 40.7% 43.5% 75.9% 69.0% Criminal Justice APPLIED 61 59.0% 53.5% 73.8% 66.5% Education APPLIED 38 44.7% 43.4% 71.1% 77.2% Engineering Technology APPLIED 39 48.7% 43.8% 64.1% 63.8% Health/Phy Ed/Rec/Nutrition APPLIED 57 50.9% 41.4% 71.9% 73.0% Nursing APPLIED 90 56.7% 59.2% 78.9% 76.1% Tech/Occupational Studies APPLIED 65 35.4% 51.4% 55.4% 62.2%
UG: Bac & AD) Degrees Awarded Fall Semester Counts Academic Year 2012-2013 Average prior 4 years Indicator 5% tolerance Difference % Department Type Change Clinical Sciences APPLIED 99 78 21 26.9% Criminal Justice APPLIED 116 99 17 17.2% Education APPLIED 57 56 1 1.8% Engineering Technology APPLIED 42 37 5 13.5% Health/Phy Ed/Rec/Nutrition APPLIED 126 107 19 17.8% Nursing APPLIED 87 87 0 0.0% - Tech/Occupational Studies APPLIED 99 99 0 0.0% -
UG Bachelor Degree Graduation Rates 2007 1stTime FT Freshman Indicator 5% tolerance of NMU Total 48.5 % Graduated After 4 Years Graduated After 5 Years Graduated After 6 Years # of Freshmen Total Graduated Department Type Clinical Sciences APPLIED 13 7 23.1% 46.2% 46.2% Criminal Justice APPLIED 45 22 31.1% 44.4% 48.9% Education APPLIED 78 41 3.8% 38.5% 50.0% Engineering Technology APPLIED 19 4 10.5% 10.5% 21.1% Health/Phy Ed/Rec/Nutrition APPLIED 66 37 24.2% 43.9% 50.0% Nursing APPLIED 108 51 18.5% 37.0% 42.6% Tech/Occupational Studies APPLIED 38 22 23.7% 36.8% 50.0% NMU ALL DEPARTMENTS 657 48.5% NMU 1355 697 20.7% 41.1% N/A
Degrees Awarded Summer 2009 through Winter 2014 2000 1800 1600 1400 1200 1000 800 600 400 200 0 1 2 3 4 5 6 7 College Total: 771 846 843 869 872 Univ Total 1,620 1,706 1,743 1,798 1,816 College Total: Univ Total
