Nonclassical Measurement Errors in Farmers' Responses
Explore the impact of nonclassical measurement errors (NCME) on farmers' responses to information treatments in agricultural surveys. The study delves into the extent, correlates, and persistence of NCME in farmers' self-reports regarding plot sizes, shedding light on how farmers adjust their reporting behaviors based on accurate information provided. The research conducted in Malawi utilizes a randomized information experiment within a nationwide agricultural household survey to investigate these phenomena.
Download Presentation

Please find below an Image/Link to download the presentation.
The content on the website is provided AS IS for your information and personal use only. It may not be sold, licensed, or shared on other websites without obtaining consent from the author. If you encounter any issues during the download, it is possible that the publisher has removed the file from their server.
You are allowed to download the files provided on this website for personal or commercial use, subject to the condition that they are used lawfully. All files are the property of their respective owners.
The content on the website is provided AS IS for your information and personal use only. It may not be sold, licensed, or shared on other websites without obtaining consent from the author.
E N D
Presentation Transcript
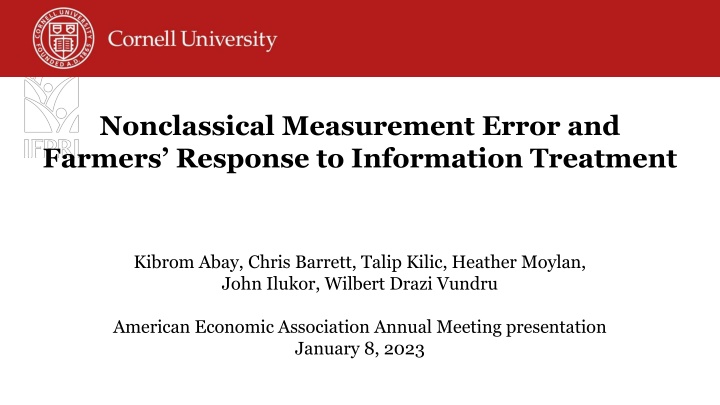
Nonclassical Measurement Error and Farmers Response to Information Treatment Kibrom Abay, Chris Barrett, Talip Kilic, Heather Moylan, John Ilukor, Wilbert Drazi Vundru American Economic Association Annual Meeting presentation January 8, 2023
Background Non-classical measurement error (NCME) widespread. Usually treated as a problem to be resolved econometrically or through improved survey design. NCME may represent more than mere misreporting/noise. If NCME reflects respondents mistaken beliefs (Abay et al. AJAE 2021), it offers a window on respondents behaviors, esp. concerning information. Information interventions rely on subjects updating beliefs. Do they? Mistaken beliefs could reflect behavioral anomalies: inattention, self- esteem or confirmation bias, etc. Mistaken beliefs about one subject may spillover to beliefs about, and reporting on, other subjects with implications for both policy design and statistical inference
What we do Embed a randomized information experiment within a nationwide agricultural household survey in Malawi to study: Extent, correlates and persistence of NCME in farmers plot size self-reports Whether/how farmers learn/adjust SRs to demonstrably accurate information about plot size, both in terms of correcting pre-existing measurement error in plot size as well as their reporting behavior (responses) on non-land agricultural inputs.
Experiment In 2019/20 Malawi IHS5 (LSMS). 72 randomly selected rural EAs, with 24 maize-growing hhs/EA 16 in treatment, remaining 8 as control group. (Balance tests show randomization worked.) Control Group Treatment Group Post-planting + post-harvest visit Post-planting visit same as post-harvest in control except for information treatment: After self-reports and plot visit, share GPS-based area and self-report measurement error (in levels and as a share of true area) Post-harvest visit exactly same as controls: Ask again about the selected plot area Mirrors the current interview flow in Malawi IHS5/IHPS and LSMS-ISA-supported surveys Post-harvest visit only w/unified agricultural questionnaire self-reported in 1 sitting by plot managers, prior to plot visit Randomly select 1 maize plot and accompany that plot s manager to the plot for demarcation and GPS-based area measurement
Familiar findings on NCME and newer ones - Regression to mean in NCME: self-reported plot sizes are overestimated for smaller plots, underestimated for larger ones. - NCME is both relatively and absolutely larger for smallest plots. - Rounding is a major source of measurement error in self-reported plot area. - Newer finding: rounding error persists (~unchanged) even after information treatment
Newer findings on NCME - Heaping around focal plots is asymmetric, esp. for smallest plots
Newer findings on NCME - NCME is the norm. Only 3.1% (31/982) accurately self-report plot size pre-treatment. - ME is heavily NC, and overwhelmingly associated w/true plot size and rounding Table 3: Characterizing measurement error in self-reported plot size - as observed prior to treatment (1) Log (SR)-log(GPS) OLS estimates Plot size Log (area: GPS)-centered -0.680*** (0.017) Log (area: GPS)-centered-square -0.014 (0.011) Rounding of values Rounding at 0.5 acre 0.419*** (0.034) Rounding at 1 acre 0.905*** (0.042) Rounding at 1.5 acre 1.186*** (0.070) Rounding at 2 acres 1.430*** (0.096) Household characteristics Plot characteristics Constant 0.006 (0.160) Controls Yes Mean dependent variable 0.313 R2 0.548 No. observations 1535 No. censored observations - Notes: The analysis uses pooled treatment and control group samples. Self-reported plot areas were reported prior to the treatment during the post-planting interview for the treatment group, and during the post-harvest interview for the control group. The first column provides OLS estimates, and the second column reports Shapley decomposition associated with the R2 in the first column. The third and fourth columns are Tobit estimates. Prior to expressing it natural logarithmic terms, GPS-based plot size was demeaned to center the data. Household characteristics include the female identifier, age, literacy, religion, marital status, and non- farm work status of the household head, as well as total farm size and number of plots managed. Plot characteristics include indicator variables for tenure status, rental or owned, pure stand cropping, soil type, and slope. Standard errors, clustered at enumeration area level, are given in parentheses. *p < 0.10, **p < 0.05, ***p < 0.01. Appendix Table A4 reports full regression results. (2) (3) (4) %Overestimation Tobit estimates -210.759*** (6.953) 11.307*** (4.097) 120.048*** (11.903) 270.761*** (15.149) 354.823*** (24.455) 401.143*** (32.847) -94.661* (55.243) Yes 96.248 1535 554 %Underestimation Tobit estimates 37.617*** (1.859) 8.928*** (1.039) -19.058*** (2.781) -58.441*** (4.025) -81.165*** (6.902) -92.946*** (9.508) -11.636 (13.848) Yes 10.423 1535 1035 Shapley 78.72% 18.28% 1.69% 1.32% 100%
Newer findings on NCME and learning Learning is sluggish among treated 3-4 months after info treatment: - 13% accurately self-report post- treatment. - Plurality (37%) don t change incorrect beliefs. - 23% report larger ME post-treatment! - 13% switch from one rounded, wrong value for another wrong, rounded one.
Newer findings on NCME and learning Incomplete and structurally asymmetric learning: Only 13% (up from 3%) correct. Overestimation magnitude unchanged but underestimation falls. Under-estimators with larger plots more likely to update and by a larger amount.
Newer findings on NCME and learning Information treatment has - no effect on fertilizer use reporting at extensive margin - significantly changes intensive margin self-reports (~7%). - treatment effects heterogeneous by plot size and by under/over-estimation. - clear evidence of spillovers on self- reporting of (early season) agricultural input use ... correlated NCME (Abay et al. JDE 2019). Optimal prediction error (Hyslop and Imbens JBES 2001)?
How to interpret? Systematic NCME strikingly consistent w/behavioral phenomena: - Inattention to salient information: may be rational (costs>benefits) or irrational (mental gaps, oversight). Variation with true plot size suggests structurally asymmetric inattention. - Self-esteem bias: land a source of status. Upwardly biased mistaken beliefs may bring non-material reward. Asymmetric NCME and focal point bunching consistent w/this. - Trust in GPS/technology and/or those who use it vs. trust in original (mis)info source. These seem hypotheses/mechanisms worth testing explicitly. We can t do so in these data.
Thank you for your interest and comments k.abay@cgiar.org cbb2@cornell.edu tkilic@worldbank.org


