Nonideal Flow in Chemical Reactors
Explore the concept of nonideal flow in chemical reactors, including the differences between ideal and real reactor behavior, dead zones, and residence time distribution. Learn how to analyze effluent concentration data and calculate the fraction of material spent in the reactor within a specific time frame.

Download Presentation

Please find below an Image/Link to download the presentation.
The content on the website is provided AS IS for your information and personal use only. It may not be sold, licensed, or shared on other websites without obtaining consent from the author. If you encounter any issues during the download, it is possible that the publisher has removed the file from their server.
You are allowed to download the files provided on this website for personal or commercial use, subject to the condition that they are used lawfully. All files are the property of their respective owners.
The content on the website is provided AS IS for your information and personal use only. It may not be sold, licensed, or shared on other websites without obtaining consent from the author.
E N D
Presentation Transcript
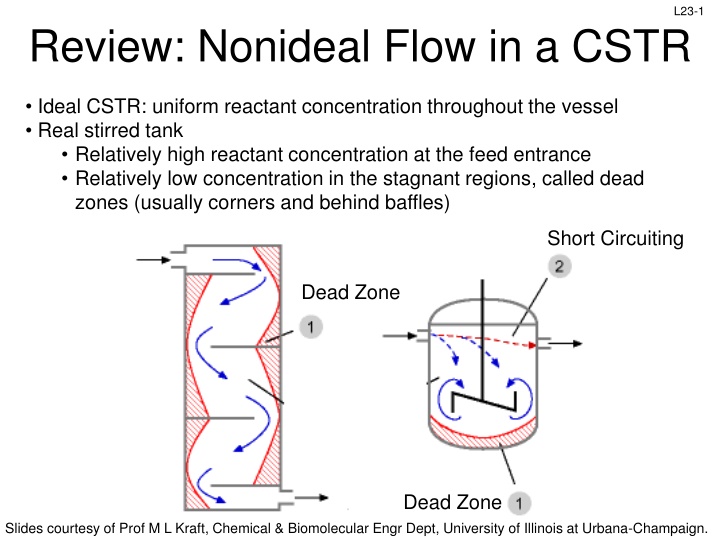
L23-1 Review: Nonideal Flow in a CSTR Ideal CSTR: uniform reactant concentration throughout the vessel Real stirred tank Relatively high reactant concentration at the feed entrance Relatively low concentration in the stagnant regions, called dead zones (usually corners and behind baffles) Short Circuiting Dead Zone Dead Zone Slides courtesy of Prof M L Kraft, Chemical & Biomolecular Engr Dept, University of Illinois at Urbana-Champaign.
Review: Nonideal Flow in a PBR Ideal plug flow reactor: all reactant and product molecules at any given axial position move at same rate in the direction of the bulk fluid flow Real plug flow reactor: fluid velocity profiles, turbulent mixing, & molecular diffusion cause molecules to move with changing speeds and in different directions channeling Dead zones Slides courtesy of Prof M L Kraft, Chemical & Biomolecular Engr Dept, University of Illinois at Urbana-Champaign.
Review: Residence Time Distribution RTD E(t) residence time distribution function RTD describes the amount of time molecules have spent in the reactor RTD is experimentally determined by injecting an inert tracer at t=0 and measuring the tracer concentration C(t) at exit as a function of time Measurement of RTD C curve C(t) X Reactor Pulse injection Detection t ( ) ( ) C t tracer conc at exit between t & t+ t sum of tracer conc at exit for infinite time ( ) = = = RTD E t C t dt 0 E(t)=0 for t<0 since no tracer can exit before it enters E(t) 0 for t>0 since mass fractions are always positive ( ) = E t dt 1 0 Fraction of material leaving reactor that has been inside reactor for a time between t1 & t2 t2 t1E t dt ( ) = Slides courtesy of Prof M L Kraft, Chemical & Biomolecular Engr Dept, University of Illinois at Urbana-Champaign.
A pulse of tracer was injected into a reactor, and the effluent concentration as a function of time is in the graph below. Construct a figure of C(t) & E(t) and calculate the fraction of material that spent between 3 & 6 min in the reactor t min C g/m3 0 1 2 3 4 5 6 7 8 9 10 12 14 0 1 5 8 10 8 6 4 3 2.2 1.5 0.6 0 To tabulate E(t): divide C(t) by the total area under the C(t) curve, which must be numerically evaluated as shown below: = 0 0 = + + 0 1 X0 Plot C vs time: 12 10 1 0 14 ( ) ( ) ( ) + C t dt C t dt C t dt 8 C(t) (g/m3) 10 6 XN 4 t ( ) ( ) f x dx + + + + f 4f 2f 4f 2f ... 4f N f 2 3 4 N 1 2 3 0 X2 3 t 0 2 4 6 8 10 12 14 t (min) ( ) ( ) f x dx = + + f 4f f 0 1 2 X0 0 m m m g min g min g min ( ) = + = C t dt 4 7. 4 2.6 50 3 3 3 Slides courtesy of Prof M L Kraft, Chemical & Biomolecular Engr Dept, University of Illinois at Urbana-Champaign.
A pulse of tracer was injected into a reactor, and the effluent concentration as a function of time is in the graph below. Construct a figure of C(t) & E(t) and calculate the fraction of material that spent between 3 & 6 min in the reactor t t min C g/m3 g/m3 E(t) min C 0 0 1 1 2 2 3 3 4 4 5 5 6 6 7 7 8 8 9 9 10 10 12 12 14 14 0 0 1 1 5 5 8 8 10 10 8 8 6 6 4 4 3 3 2.2 2.2 1.5 1.5 0.6 0.6 0 0 0 0.02 0.1 0.16 0.2 0.16 0.12 0.08 0.06 0.044 0.03 0.012 0 g min m ( ) = C t dt 50 3 Plot E(t): 0.25 0 ( ) C t Tabulate E(t): divide C(t) by the total area under the C(t) curve: ( ) = E t 0.2 ( ) C t dt E(t) (min-1) 0.15 0 0.1 0 1 ( ) 0 ( ) 1 = = = = E t 0 E t 0.02 0.05 50 5 50 50 8 50 0 0 2 4 t (min) 6 8 10 12 14 ( ) 3 ( ) 2 = = = = E t 0.16 E t 0.1 Slides courtesy of Prof M L Kraft, Chemical & Biomolecular Engr Dept, University of Illinois at Urbana-Champaign.
Review: RTD Profiles & Cum RTD Function F(t) E(t) E(t) E(t) E(t) t t t t Nearly ideal PFR Nearly ideal CSTR PBR with channeling & dead zones CSTR with dead zones t ( ) = F(t)=fraction of effluent in the reactor less for than time t F(t) E t dt 0 F(t) ( ) ( ) ( ) = = F t F t F 0 when t<0 0 when t 1 0.8 80% of the molecules spend 40 min or less in the reactor 0 ( ) ( ) 1 F t = E t dt t (min) t 40 Slides courtesy of Prof M L Kraft, Chemical & Biomolecular Engr Dept, University of Illinois at Urbana-Champaign.
L23-7 Review: Relationship between E & F F(t) = fraction of effluent that has been in the reactor for less than time t t ( ) = F(t) E t dt 0 ( ) C t ( ) = E t ( ) C t dt 0 E(t)= Fraction of material leaving reactor that was inside for a time between t1 & t2 Slides courtesy of Prof M L Kraft, Chemical & Biomolecular Engr Dept, University of Illinois at Urbana-Champaign.
L23-8 Review: Mean Residence Time, tm For an ideal reactor, the space time is defined as V/ 0 The mean residence time tm is equal to in either ideal or nonideal reactors ( ) ( ) 0 tE t dt V 0 ( ) = = t = = = t tE t dt 0 m m E t dt 0 By calculating tm, the reactor V can be determined from a tracer experiment 2 ( ) ( ) 2 = 0t t E t dt The spread of the distribution (variance): m Space time and mean residence time tm would be equal if the following two conditions are satisfied: No density change No backmixing In practical reactors the above two may not be valid, hence there will be a difference between them Slides courtesy of Prof M L Kraft, Chemical & Biomolecular Engr Dept, University of Illinois at Urbana-Champaign.
L23-9 Significance of Mixing RTD provides information on how long material has been in the reactor RTD does not provide information about the exchange of matter within the reactor (i.e., mixing)! For a 1st order reaction: dX dt ( ) = k 1 X Concentration does not affect the rate of conversion, so RTD is sufficient to predict conversion But concentration does affect conversion in higher order reactions, so we need to know the degree of mixing in the reactor Macromixing: produces a distribution of residence times without specifying how molecules of different age encounter each other and are distributed inside of the reactor Micromixing: describes how molecules of different residence time encounter each other in the reactor Slides courtesy of Prof M L Kraft, Chemical & Biomolecular Engr Dept, University of Illinois at Urbana-Champaign.
L23-10 Quality of Mixing RTDs alone are not sufficient to determine reactor performance Quality of mixing is also required Goal: use RTD and micromixing models to predict conversion in real reactors 2 Extremes of Fluid Mixing Maximum mixedness: molecules are free to move anywhere, like a microfluid. This is the extreme case of early mixing Slides courtesy of Prof M L Kraft, Chemical & Biomolecular Engr Dept, University of Illinois at Urbana-Champaign.
L23-11 Quality of Mixing RTDs alone are not sufficient to determine reactor performance Quality of mixing is also required Goal: use RTD and micromixing models to predict conversion in real reactors 2 Extremes of Fluid Mixing Maximum mixedness: molecules are free to move anywhere, like a microfluid. This is the extreme case of early mixing Complete segregation: molecules of a given age do not mix with other globules. This is the extreme case of late mixing Slides courtesy of Prof M L Kraft, Chemical & Biomolecular Engr Dept, University of Illinois at Urbana-Champaign.
L23-12 Complete Segregation Model Mixing of different age groups at the last possible moment Flow is visualized in the form of globules Each globule consists of molecules of the same residence time Different globules have different residence times No interaction/mixing between different globules The mean conversion is the average conversion of the various globules in the exit stream: ( ) ( ) j t E t = X X t j A A j Conversion achieved after spending time tj in the reactor Fraction of globules that spend between tj and tj + t in the reactor XA(t) is from the batch reactor design equation t 0 ( ) ( ) t E t dt = X X A A 0 Slides courtesy of Prof M L Kraft, Chemical & Biomolecular Engr Dept, University of Illinois at Urbana-Champaign.
L23-13 Complete Segregation Example First order reaction, A Products dX dt dX dt Batch reactor design equation: dX N A A = = N kC V N r V A0 A A0 A dX dt ( ) ( ) A A = 1 X = 1 X kC V N kN A0 A0 A A0 A0 A dt dX dt ( ) A = 1 e = ( ) t kt k 1 X X A A To compute conversion for a reaction with a 1st order rxn and complete segregation, insert E(t) from tracer experiment and XA(t) from batch reactor design equation into: ( ) ( ) A A 0 = X X t E t dt & integrate Slides courtesy of Prof M L Kraft, Chemical & Biomolecular Engr Dept, University of Illinois at Urbana-Champaign.
L23-14 Maximum Mixedness Model In a PFR: as soon as the fluid enters the reactor, it is completely mixed radially with the other fluid already in the reactor. Like a PFR with side entrances, where each entrance port creates a new residence time: 0E( ) 0 0 + + V = 0 V = V0 : time it takes for fluid to move from a particular point to end of the reactor ( ) volumetric flow rate at , = flow that entered at + plus what entered through the sides E( ) Volumetric flow rate of fluid fed into side ports of reactor in interval between + & Volumetric flow rate of fluid fed to reactor at : fraction of effluent in reactor for less than time t ( ) ( ) ( ) = = 1 F E d 0 0 ( ) = 1 F Volume of fluid with life expectancy between + & : V 0 Slides courtesy of Prof M L Kraft, Chemical & Biomolecular Engr Dept, University of Illinois at Urbana-Champaign.
L23-15 Maximum Mixedness & Polymath dX r d C fraction of effluent in reactor for less than time t residence time distribution function ( ) ( ) E Mole balance on A gives: A A = + X A 1 F A0 E(t) must be specified Often it is an expression that fits the experimental data 2 curves, one on the increasing side, and a second for the decreasing side Use the IF function to specify which E is used when E1 E2 E See section 13.8 in book t Also need to replace because Polymath cannot calculate as gets smaller z T where T is the longest time measured = ( ( A0 dz C 1 F T z ) E T z dX r Note that the sign on each term changes A A = X ) A Slides courtesy of Prof M L Kraft, Chemical & Biomolecular Engr Dept, University of Illinois at Urbana-Champaign.


