Normal Distribution in Statistics
Explore the concept of normal distribution, a crucial model in statistics, describing real-world situations with a bell-shaped curve. Learn about its characteristics, defining parameters, and the standard normal variate transformation.

Download Presentation

Please find below an Image/Link to download the presentation.
The content on the website is provided AS IS for your information and personal use only. It may not be sold, licensed, or shared on other websites without obtaining consent from the author. If you encounter any issues during the download, it is possible that the publisher has removed the file from their server.
You are allowed to download the files provided on this website for personal or commercial use, subject to the condition that they are used lawfully. All files are the property of their respective owners.
The content on the website is provided AS IS for your information and personal use only. It may not be sold, licensed, or shared on other websites without obtaining consent from the author.
E N D
Presentation Transcript
STATISTICS B.A./B.Sc. Semester II (Paper I) NORMAL DISTRIBUTION A CONTINUOUS DISTRIBUTION Compiled by Dr. SYED ATHAR HASAN RIZVI Associate Professor, Department of Statistics, Shia P. G. College, Lucknow.
About Normal (Gaussian) Distribution The normal distribution is a descriptive model that describes real world situations. It is defined as a continuous frequency distribution of infinite range (can take any values not just integers as in the case of Binomial and Poisson Distributions i.e., Discrete Distributions). This distribution in Statistics and important tool in analysis of epidemiological management science. is the most important probability data and
Normal Distribution as Limiting Form: Normal distribution may be looked upon as the limiting form of Binomial distribution under certain conditions n, the No. of trials is indefinitely large , Neither p or q is very small. n
Normal Distribution as mathematical function: 1 x 1 2) ( = ( ) f x e 2 2 This is a bell shaped curve with different centers and spreads depending on and Note constants: =3.14159 e=2.71828
Normal distribution is defined by its Mean and Standard dev. + 1 x 1 2) ( E(X)= = = e x 2 dx 2 . ( ) x f x dx 2 x Var(X)= 2= ( ) X ( ) 1 1 2 2 x e = E dx 2 2 Standard Deviation(X)=
Standard Normal Variate (Z) All normal distributions can be converted into the standard normal curve by subtracting the mean and dividing by the standard deviation: =X Z Standard a called is Z Normal Variate (SNV)
Parameters of Standard Normal Distribution
Characteristics of Normal Distribution It links frequency distribution to probability distribution Has a Bell Shaped Curve It is Symmetric around the mean: Two halves of the curve are the same (mirror images) Hence Mean = Median= Mode
Characteristics of Normal Distribution The total area under the curve is 1 (or 100%) The curve is asymptotic i.e., it becomes parallel to X axis at both the tails. 2= , 3 the curve is Meso - kurtic The coefficient of Kurtosis Since the curve is symmetrical, the coefficient of skewness 0 1= Normal Distribution has the same shape as Standard Normal Distribution. Odd order moments vanish.
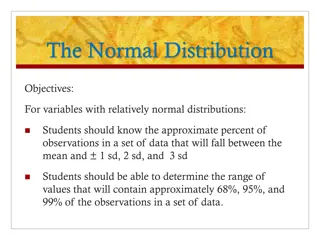
68.26 % of values are within 1 standard deviation of the mean The Standard Deviation: 95.45% of values are within 2 standard deviations of the mean is a measure of how spread out numbers are. 99.73% of values are within 3 standard deviations of the mean
Why do we need to know Standard Deviation? Any value is likely to be within 1 standard deviation of the mean. very likely to be within 2 standard deviations . almost certainly within 3 standard deviations.
The properties of a normal distribution: It is a bell-shaped curve. It is symmetrical about the mean, . (The mean, the mode and the median all have the same value). The total area under the curve is 1 (or 100%). 50% of the area is to the left of the mean, and 50% to the right. 50% 50%
The properties of a normal distribution: It is a bell-shaped curve. It is symmetrical about the mean, . (The mean, the mode and the median all have the same value). The total area under the curve is 1 (or 100%). 50% of the area is to the left of the mean, and 50% to the right. Approximately 68% of the area is within 1 standard deviation, , of the mean. 68% - +
The properties of a normal distribution: It is a bell-shaped curve. It is symmetrical about the mean, . (The mean, the mode and the median all have the same value). The total area under the curve is 1 (or 100%). 50% of the area is to the left of the mean, and 50% to the right. Approximately 68% of the area is within 1 standard deviation, , of the mean. Approximately 95% of the area is within 2 standard deviations of the mean. 95% -2 - + +2
The properties of a normal distribution: It is a bell-shaped curve. It is symmetrical about the mean, . (The mean, the mode and the median all have the same value). The total area under the curve is 1 (or 100%). 50% of the area is to the left of the mean, and 50% to the right. Approximately 68% of the area is within 1 standard deviation, , of the mean. Approximately 95% of the area is within 2 standard deviations of the mean. Approximately 99% of the area is within 3 standard deviations of the mean. 99% -3 -2 - + +2 +3
How to measure the area under the normal curve Example : = = = = normal A curve has x 20 , between area the find 10, 10 and 40 . x x 1 2 X X = Z 15 20 5 = = = 5 . 0 z 1 10 10 40 20 20 = = = 2 z 2 10 10 Refer = area = table : = = z 0.5 0.1915 and z + 2 0.4772 = 1 2 0.1915 = Total Area 0.4772 0.6687
Curves of example. = 20 x 1= x 2= 15 40 x 1= z 5 . 0 2= 2 z = 20 x 2= x 1= x 40 15
References: Introductory Statistics (2nd Edition) by Wonnacott, Thomas H. and Wonnacott Ronald J., Published by John Wiley & Sons, USA (1972). Larson/ Farber, 4th Edition 1. 2.

 Distribution")


")
")