Northeast Oahu Fish Community Assessment
Explore the impact of the 2014-2015 bleaching event on fish communities in Northeast Oahu through abundance data comparisons before and after the event. Hypothesized decline in fish abundances from 2013 to 2016 surveys is examined, with data on samples, species, environmental variables, data processing, analysis, and results presented.

Download Presentation

Please find below an Image/Link to download the presentation.
The content on the website is provided AS IS for your information and personal use only. It may not be sold, licensed, or shared on other websites without obtaining consent from the author. If you encounter any issues during the download, it is possible that the publisher has removed the file from their server.
You are allowed to download the files provided on this website for personal or commercial use, subject to the condition that they are used lawfully. All files are the property of their respective owners.
The content on the website is provided AS IS for your information and personal use only. It may not be sold, licensed, or shared on other websites without obtaining consent from the author.
E N D
Presentation Transcript
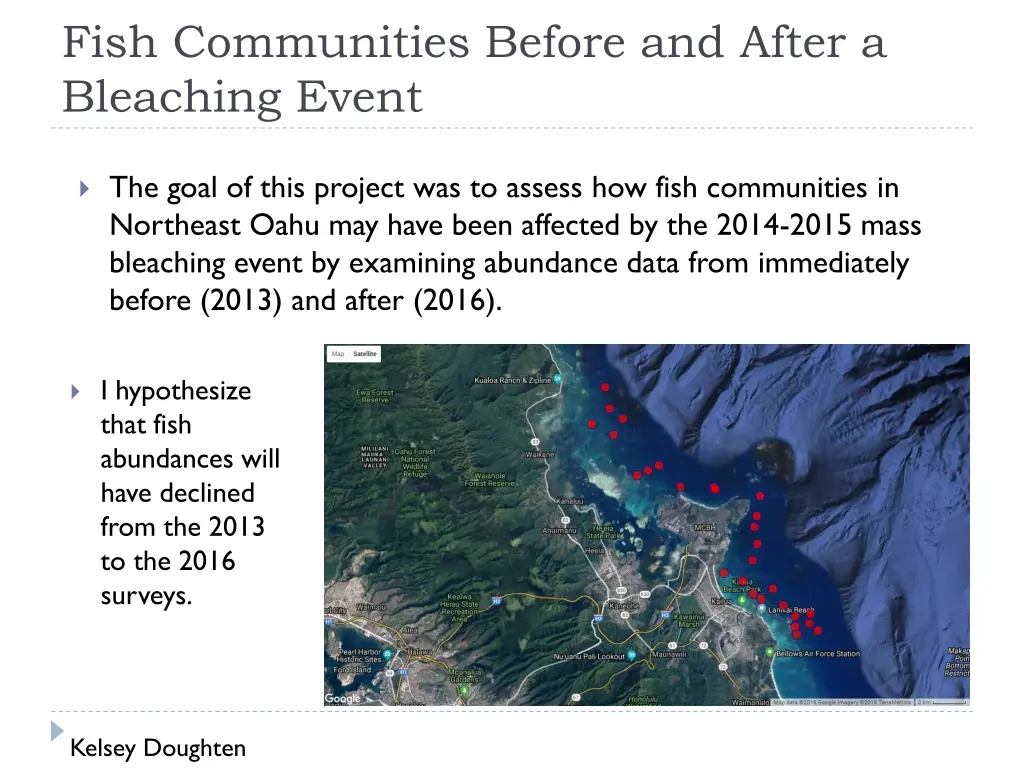
Fish Communities Before and After a Bleaching Event The goal of this project was to assess how fish communities in Northeast Oahu may have been affected by the 2014-2015 mass bleaching event by examining abundance data from immediately before (2013) and after (2016). I hypothesize that fish abundances will have declined from the 2013 to the 2016 surveys. Kelsey Doughten
Data Description Data files: projectMM.wk1 (main) and projectSM.wk1 (second) 28 samples and 47 species Samples are coral reef surveys, species are fish counts Environmental variables are: Time (year: 2013 and 2016) Depth (zone: shallow, mid, deep) Hard coral cover (percent)
Data Processing Skewness: Species data: Avg. = 2.0 (1.0 < skew < 4.2) Environmental data: Avg. = 0.2 (0.0 < skew < 0.4) Outliers (2 SD cutoff): Samples: s1 (+2.66 SD) Species: PSCE (+2.49 SD), PARR (+2.22 SD), and PSEV (+2.17 SD) After log(x+1) transformation and general relativization: Skewness: Avg. = 1.0 (-0.7 < skew < 3.0) One sample was discarded: s1 (+2.92 SD) Two species were discarded: PSEV (+2.55 SD) & PSCE (+2.17 SD) 27 samples and 45 species
Results Conclusion: 3-dimensional solution Criterion 1: decline in stress with added axis at least 5 Criterion 2: p value < 0.05
Results NMDS Scree Plot 60 Real Data Randomized Data Maximum Mean Minimum 40 Stress 20 0 1 3 5 Dimensions
Results Coefficient of determination (% variance explained by axes) Orthogonality (independence of the axes)
Results NMDS Ordination Plot Year s26 100 s27 s24 s25 2013 s19 s23 80 s21 s28 s16s17 s20 s18 2016 s22 Axis 2 60 s15 s14 s9 s10 s5 s12 s2 40 s6 s8 s7 s3 s13 20 s4 s11 0 0 5 101520253035 0 20 40 Axis 1 60 80 100 35 Coral 30 Axis 1 25 r = .103 tau = .142 Axis 2 r = -.306 tau = -.165 20 15 10 5 0
Results NMDS Ordination Plot ACNR CAGA CEPO CHHA CIFA PAFO THBA Depth Shallow Mid Deep s26 100 s27 2016 s24 s19 80 s25 s23 s16 s17 s21 s28 s18 s20 60 s22 Axis 2 s15 s14 2013 s9 s12 s2 40 s10 s5 s6 s13 s7 s3 20 s8 ACOL CAJA SUBU s4 s11 0 ACLE CHSO CTST PLIM OXBI SUFR 0 20 40 60 80 100 Axis 1
Results Axis 1: Positive: OXBI ( = 0.677) and SUFR ( = 0.536) Secondary consumers Negative: ACLE ( = -0.519), CHSO ( = -0.480), CTST ( = 0.540) Primary consumers Axis 2: Positive: ACNR ( = 0.487), CAGA ( = 0.488), CEPO ( = 0.574), CHHA ( = 0.549), CIFA ( = 0.525), PAFO ( = 0.567), THBA ( = 0.541) Primary (2), secondary (2), piscivores (2), planktivore (1) Negative: ACOL ( = -0.512), CAJA ( = -0.426), SUBU ( = -0.431) Primary (2) and secondary (1)
Discussion What do these results mean for the hypothesis? No apparent relationship between depth and fish community Slight relationship between coral cover and fish community Strong relationship between the composition of fish communities before the bleaching event and after Suggests possibility for underlying relationship with bleaching Or perhaps something else? What did this exercise teach you regarding your overreaching analysis, methods, and objectives? Community data is complex and NMDS provides a great way to assess many different relationships at once but data exploration is very important to ensure you are getting results actually representative of the real data
Discussion: Next Steps For re-analysis of the data, I would like to do a MRPP test to further investigate the relationship between fish assemblages before and after the bleaching event. To further this study Assess more environmental variables Structural complexity Actual depths (rather than zones) Different sides of island Other benthic coverage (such as macroalgae, CCA, sand, etc.) Live vs. dead coral cover Add data from 2015 surveys Fish consumer groups