Northwest Arkansas CoC 2023 Point-in-Time Count Overview
This report presents the findings of the Northwest Arkansas Continuum of Care 2023 Point-in-Time Count, detailing the methodology, methodological changes, and an overview of sheltered and unsheltered populations across different age groups. The data collected provides valuable insights into homelessness within the region.

Download Presentation

Please find below an Image/Link to download the presentation.
The content on the website is provided AS IS for your information and personal use only. It may not be sold, licensed, or shared on other websites without obtaining consent from the author.If you encounter any issues during the download, it is possible that the publisher has removed the file from their server.
You are allowed to download the files provided on this website for personal or commercial use, subject to the condition that they are used lawfully. All files are the property of their respective owners.
The content on the website is provided AS IS for your information and personal use only. It may not be sold, licensed, or shared on other websites without obtaining consent from the author.
E N D
Presentation Transcript
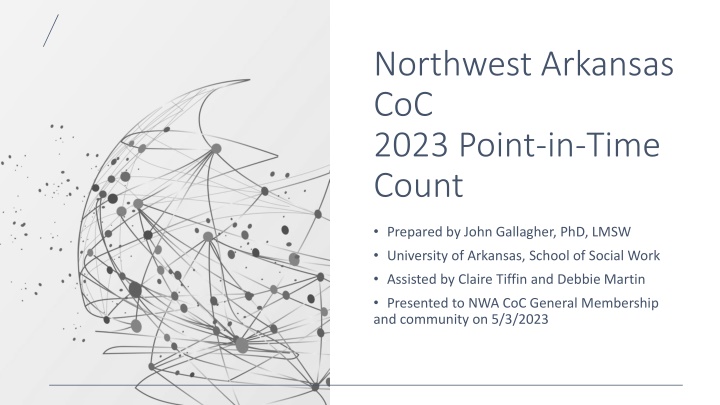
Northwest Arkansas CoC 2023 Point-in-Time Count Prepared by John Gallagher, PhD, LMSW University of Arkansas, School of Social Work Assisted by Claire Tiffin and Debbie Martin Presented to NWA CoC General Membership and community on 5/3/2023
Background & methods HUD requires all CoCs to conduct a point-in-time count of all individuals experiencing homelessness in their regions at least every other year during the last week in January. To be counted, we use HUD s definition of homelessness which focuses on individuals in shelters, living in situations not meant for human habitation, and unsheltered. We augment PIT data with reports from school districts and charters in the 4 NWA counties, using less stringent definition. The PIT was conducted on January 27, 2023. The UofA School of Social Work coordinated the PIT for the second time this year. Led by John Gallagher, associate professor Assisted by Claire Tiffin, MSW intern We obtained PIT data from 4 sources: Complete interviews: Observation forms: Provider-level data: HMIS data: 71% 10% 15% 5% HUD does not allow reporting of cases with missing data on demographic variables. They require imputation. Our rates of missing data were low (1% - 5%). For consistency with HUD data, we report the imputed values here (but note rates of missing in slide notes)
Methodological changes Developed and administered a survey for community leaders in smaller NWA communities to better identify locations Increased the extent and independence from law enforcement of our unsheltered count Redesigned observation form to 1) discourage inappropriate usage and 2) increase quality of data when used Used HMIS data to assist in data validation de-duplication, and quality Improved items used to assess disability (which helps establish chronicity) Replaced a generic LGBTQ item with one focused on sexual orientation (as a rich gender item was already in use) Added items regarding histories of felony arrest, evictions, and foster care. Added a qualitative item inquiring on participant s perspective of single fator that most contributes to their homelessness Improved question regarding if any aspect of identity impacts service receipt Began (again) reporting data at city as well as county level Per HUD, began using broader array of age categories for reporting Changed day of count from Thursday to Friday
Overview and age groups Emergency shelter Transitional shelter Unsheltered Total Households 161 24 178 363 Persons 200 45 191 436 Under age 18 35 18 10 63 (14%) Ages 18 to 24 10 0 18 28 (6%) Ages 25 to 34 34 6 38 78 (18%) Ages 35 to 44 43 6 51 100 (23%) Ages 45 to 54 49 9 42 100 (23%) Ages 55 to 64 23 6 23 52 (12%) Ages 65 and above 6 0 9 15 (3%)
Gender, race, ethnicity, & sexual orientation Regional pop. est. Emergency shelter (n=200) Transitional shelter (n=45) Unsheltered (n=191) Total (n=436) Male 60% 43% 62% 59% Female 38% 55% 35% 39% Transgender* 2% 0% 2% 2% Gay or bisexual** 4% 14% 8% 6% Hispanic 16% 10% 4% 7% 8% AI/AN/Indigenous 3% 4% 13% 2% 4% Asian 4% 0% 0% 1% 0% Black/African American 3% 19% 35% 8% 16% Pacific Islander 2% 3% 0% 8% 5% White 86% 73% 51% 75% 72% Multiple races -- 1% 0% 6% 3%
Populations and characteristics Emergency shelter Transitional shelter Unsheltered Total First time homeless* 54 4 70 128 (52%) Chronic 42 N/A 73 115 Veteran 25 0 13 38 (16%) SSA/VA disabled 37 2 30 69 (29%) Mental health 65 4 67 136 (58%) Substance use 36 3 44 83 (41%) Physical disability 37 4 49 90 (38%) Developmental disability 15 0 20 35 (15%) HIV/AIDS 0 0 1 1 (0%) 1 or more disability 90 40 83 203 (47%)
Populations and characteristics Emergency shelter Transitional shelter Unsheltered Total Domestic violence 55 16 20 91 (33%) Foster care history 18 0 28 46 (20%) Felony record 32 3 55 91 (41%) Eviction on record 21 6 30 57 (28%)
Emergency shelter Transitional shelter Unsheltered Total Households 25 0 12 37 Persons 25 0 13 38 Veteran homelessness Veterans 25 0 13 38 Male 21 0 11 32 Female 2 0 2 4 Transgender 1 0 0 1 Chronic 10 -- 7 17
Emergency shelter Transitional shelter Unsheltered Total Benton County 96 4 23 123 PIT Data by Counties and Cities Bentonville 60 0 2 62 Rogers 36 4 17 57 Carroll County 0 0 8 8 Madison County 0 0 3 3 Washington County 104 41 157 302 Fayetteville 102 41 119 262 Springdale 2 0 38 40
Last stably housed LAST STABLY HOUSED LOCATION RESPONSES Benton County 43 (17.8%) Carroll County 6 (2.5%) We asked individuals* where they lived when they last considered themselves to be stably housed. Madison County 3 (1.2%) Washington County 116 (48.1%) Elsewhere in Arkansas 25 (10.4%) Elsewhere in the U.S. 45 (18.7%) Another country 3 (1.2%)
Identity and access to services Number Positive respondents All respondents Disability 27 40% 12% 30% of respondents* indicated that one or more aspect(s) of their identity made it harder or easier to get services. Criminal record 15 22% 7% Race or ethnicity 7 10% 3% Gender 7 10% 3% Not sure or refused to specify 5 7% 2% Other 17 25% 8% Sexual orientation 2 3% 1% Age 6 9% 3%
We asked: Which single factor do you feel contributes most to your current homelessness? 229 individuals identified 1 or two factors. 23 individuals identified 2 factors The 229 represent 88% of those who could have responded (adults who provided information via the full interview) We reduced these responses into 14 codes (including Not sure and a broad other category comprising several diverse topics). On the following slide, we present those codes, their frequency and percentages among actual and potential respondents.
Identified factor Number Percent of responders Percent of potential Employment, income & finances 57 25% 22% Domestic violence 30 13% 11% Family issues (non-DV) 27 12% 10% Mental Health 21 9% 8% Housing costs/eviction record 21 9% 8% Other (several diverse factors) 19 8% 7% Substance use 18 8% 7% Criminal record 12 5% 5% Social issues (e.g., racism, sexism, community violence, police) 11 5% 4% Physical health or disability 11 5% 4% Choice/personal responsibility 9 4% 3% Unsure 8 3% 3% Identification, other 5 2% 2% Transportation 3 1% 1%
PIT data: Trends over time 2020 2021* 2022 2023 Households 296 97 251 333 Persons 352 157 343 436 Emergency shelter 172 90 165 200 Transitional shelter 25 67 78 45 Unsheltered 155 N/A 100 191 Chronic 98 19 49 116 Veteran 33 14 30 38
Reports from school districts and charters Arkansas Art Academy Bentonville Berryville Elkins Eureka Springs Districts/charters are required to track students experiencing homelessness, using a more liberal definition. Farmington Fayetteville Gentry Gravette Green Forest Greenland Haas Hall Hope Academy Huntsville Lincoln Each year, we request data from all districts/charters in the 4 NWA counties. This year, we received data from the following entities. Pea Ridge Prairie Grove Rogers Siloam Springs Springdale West Fork
Shelters Doubled- up Unaccompanied Hotel Unsheltered Total School district data: By grade and status Kindergarten 1stgrade 2ndgrade 3rdgrade 4thgrade 5thgrade 6thgrade 7thgrade 8thgrade 9thgrade 10thgrade 11thgrade 12thgrade Ungraded Total 7 6 9 6 8 8 9 9 193 199 171 173 156 184 163 148 153 178 131 99 116 22 2086 1 3 3 1 3 1 3 6 11 14 14 16 32 0 108 24 34 20 23 31 31 23 24 28 27 15 15 10 3 308 5 2 2 4 2 7 1 3 6 5 5 3 4 0 230 244 205 207 200 231 199 190 209 242 184 145 164 25 2675 11 18 19 12 2 0 124 49
Pop. Est. Shelter Doubled-up Unaccompanied Hotel Unsheltered Total Asian 4% 2% 1% 1% 0% 0% 1% AI/AN 3% 3% 1% 2% 22% 1% 10% Black/AA 3% 6% 7% 6% 7% 4% 6% Pacific Isl. 2% 7% 6% 3% 5% 10% 6% White 86% 61% 46% 34% 35% 63% 45% Multiracial -- 4% 16% 2% 36% 2% 17% Hispanic 16% 19% 23% 32% 17% 12% 22% Total -- 125 2,089 103 307 52 2,676 School district data: By race and ethnicity
2020 2021* 2022 2023 Sheltered 113 11 105 125 Doubled-up 1,813 466 1,791 2,089 Unaccompanied youth 50 12 95 103 Hotel 189 58 255 307 Unsheltered 23 -- 22 52 Total 2,188 547 2,268 2,676 School district data: Trends over time
Key findings Numbers are up in most categories this year, importantly: Households: 251 to 333 Individuals: 343 to 436 Unsheltered: 100 to 191 Chronic: 49 to 116 This is likely a mix of improved methods and true increases. Roughly 70% of unhoused individuals lived in NWA immediately before becoming homeless. Significantly elevated rates of disability, foster care history, domestic violence, and other social factors.
Strengths Increase in the extent of unsheltered counting: In absolute terms and independent of law enforcement Grew partnerships in Carroll and Madison Counties Increased data quality: Increased use of full interview from 51 % to 71% Began using HMIS data Improved quality of observation form Improvements in disability-related items
Limitations Despite improvements, undercount still likely Despite significant efforts at de-duplication, some duplicate entries are possible Inherent limits of HUD s methodology: Point-in-time: has obvious advantages, but obscures far larger number who experience homelessness cyclically Narrow definition: especially alongside the point-in-time approach misses large number of people experiencing housing insecurity (frequently extreme) Assessment of disabling conditions: Despite improvements, inherent limits
Discussion, summary, key points Changes in time: First, challenges of conducting a complete census must be borne in mind and year-to-year variations seem unavoidable and not inherently attributed to true change in population size. Consistent methods over time increase ability to track trends. Emergency shelter capacity increased due to cold weather this year, while transitional shelter capacity decreased. Racial and ethnic disparities Differences need to be examined based on types of homelessness (e.g., unsheltered vs. sheltered; individual vs. families). African-Americans are the only group from our PIT data that have significant disparities (over-representation in emergency and transitional shelters). Pacific Islanders are over-represented among unsheltered this year. Interestingly, in addition to African-Americans, members of the Latinx and Pacific Islander communities had quite large disparities in data from the schools. The reasons that we do not see the same patterns in our data are worth considering. Impact of identity on services 30% of respondents endorsed it as negatively affecting accessibility The frequent identification of disability and criminal histories is noteworthy. Importance of social and behavioral health factors: Domestic violence, mental health, and substance use frequently involved in paths to homelessness. This does not negate underlying macro economic factors such as housing/labor markets and response to individuals with disabilities in society. But, it highlights how particularly vulnerable some individuals are in an increasingly tight housing market.
Next steps The University of Arkansas School of Social Work will continue coordinating the PIT. Ongoing work to increase partnerships and reduce undercounts especially in: Springdale Siloam Springs Carroll County Madison County Consider pros and cons of Thursday vs. Friday count
Contact information John Gallagher, PhD., LMSW Debbie Martin Associate Professor of Social Work University of Arkansas 479-575-2368 Executive Director Northwest Arkansas Continuum of Care 479-717-7737 jmgallag@uark.edu debbie.martin@nwacoc.com