Discover Northwestern University's exceptional investment returns over the past two decades, totaling billions of dollars. Explore the university's strategic financial decisions and the assets held by various schools. Gain insights into the university's financial success and its approach to handling returns and resources.
Please find below an Image/Link to download the presentation.
The content on the website is provided AS IS for your information and personal use only. It may not be sold, licensed, or shared on other websites without obtaining consent from the author. If you encounter any issues during the download, it is possible that the publisher has removed the file from their server.
You are allowed to download the files provided on this website for personal or commercial use, subject to the condition that they are used lawfully. All files are the property of their respective owners.
The content on the website is provided AS IS for your information and personal use only. It may not be sold, licensed, or shared on other websites without obtaining consent from the author.
E N D
Presentation Transcript
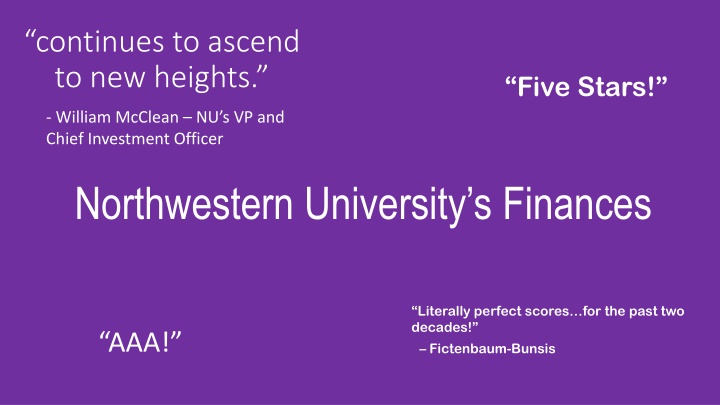
continues to ascend to new heights. Five Stars! - William McClean NU s VP and Chief Investment Officer Northwestern University s Finances Literally perfect scores for the past two decades! Fictenbaum-Bunsis AAA!
Investment Returns Investment Returns Investment returns of over $1 Billion for each of the past two years. Investment returns of over $1 Billion for each of the past two years. 2018: $1,073,758,000 2017: $1,087,366,000 Not all of these returns are spent. The university reinvests ~%40 of it. Here s what the university decided not to spend on research and support for workers. 2018: $426,557,000 2017: $482,832,000
Total Investment Returns from 2018 to 2000 (thousands of $) $1,500,000.00 $1,000,000.00 $500,000.00 $- 2018 2017 2016 2015 2014 2013 2012 2011 2010 2009 2008 2007 2006 2005 2004 2003 2002 2001 2000 $(500,000.00) $(1,000,000.00) $(1,500,000.00)
Total Returns vs. Investment Returns Used in Operations (thousands of $) $1,500,000.00 $1,000,000.00 $500,000.00 $- 2018 2017 2016 2015 2014 2013 2012 2011 2010 2009 2008 2007 2006 2005 2004 2003 2002 2001 2000 $(500,000.00) $(1,000,000.00) $(1,500,000.00)
A Couple Notes A Couple Notes Guaranteed 6th Year Funding would NOT be a new expenditure. The University has been reporting TA-ships, RA-ships, fellowships, and IGAs as parts of their bottom lines for years, even as TGS says this funding is unbudgeted.1 1 - https://www.tgs.northwestern.edu/funding/phd-student-funding-faqs.html
Total Assets by School $14,000,000,000 $12,000,000,000 $10,000,000,000 $8,000,000,000 $6,000,000,000 $4,000,000,000 $2,000,000,000 $0 Brandeis Carnegie Rochester Brown Vandy Johns Hopkins USC Chicago Wash U NYU Emory Northwestern
Total Assets by School FY 2016 vs. NU Total Assets 2005-2016 (each school corresponds to a year) $16,000,000,000 $14,000,000,000 $12,000,000,000 $10,000,000,000 $8,000,000,000 $6,000,000,000 $4,000,000,000 $2,000,000,000 $0 Brandeis Carnegie Rochester Brown Vandy Johns Hopkins USC Chicago Wash U NYU Emory Northwestern Total Assets by School NU Total Assets 2005-2016
Unrestricted Assets Unrestricted Assets The endowment is made of assets of several classes. Permanently Restricted Temporarily Restricted Unrestricted Northwestern s 2018 Unrestricted Assets: $7,654,713,000 Larger than the entire endowments of: Brandeis, Carnegie Mellon, Rochester, Brown University, and Vanderbilt.
Fictenbaum Fictenbaum- -Bunsis Bunsis Ratios Ratios Four Ratios, very useful for measuring university finances. Primary Reserve Ratio: Total Reserves/Expenses Good Ratio: >%50 Northwestern: Never dipped below %350 from 2000-2018 %429.4 in 2018 Viability Ratio: Total Reserves/Debt Good Ratio: %150-200 Northwestern: Never dipped below %300 from 2000-2018 %326.3 in 2018
Fictenbaum Fictenbaum- -Bunsis Bunsis Ratios Ratios Net Income Ratio: Change in Net Assets/Total Revenue Good ratio: %0-5 Northwestern: %18.6 in 2018 Cash Flow Ratio: Operating Cash Flow/Total Revenue Good Ratio: %0-5 Northwestern: %49.1 in 2018
Now What? If you are interested in working with NUGW on funding issues, just meet with me after Q&A. Also, talk to Ben or myself to find out about 6th year funding petitions working through your department. Lastly, the Research Committee of NUGW has created a spreadsheet of Northwestern s financial reports from 2018 to 2000 covering everything from their Fictenbaum-Bunsis ratios to cash flows. And it s public! Just go to: nugradworkers.org


")