November 2021 Education and Enforcement Summary Report
Gain insights into the November 2021 status report encompassing education, licensee support, enforcement, and complaints in various units including Liquor, Cannabis, and Tobacco/Vapor. Explore educational outreach efforts, top educational topics, enforcement statistics, and specific data on Cannabis and Liquor complaints. Discover accomplishments, compliance details, and key focus areas in this comprehensive report.

Download Presentation

Please find below an Image/Link to download the presentation.
The content on the website is provided AS IS for your information and personal use only. It may not be sold, licensed, or shared on other websites without obtaining consent from the author. If you encounter any issues during the download, it is possible that the publisher has removed the file from their server.
You are allowed to download the files provided on this website for personal or commercial use, subject to the condition that they are used lawfully. All files are the property of their respective owners.
The content on the website is provided AS IS for your information and personal use only. It may not be sold, licensed, or shared on other websites without obtaining consent from the author.
E N D
Presentation Transcript
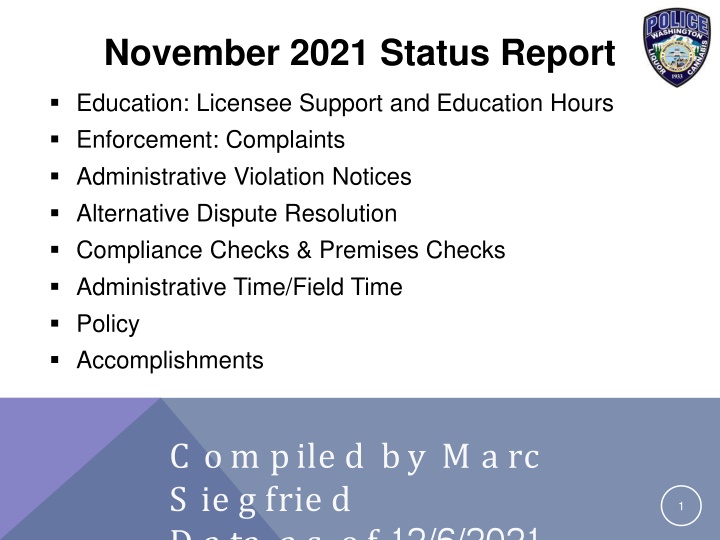
November 2021 Status Report Education: Licensee Support and Education Hours Enforcement: Complaints Administrative Violation Notices Alternative Dispute Resolution Compliance Checks & Premises Checks Administrative Time/Field Time Policy Accomplishments C o m pile dbyM a rc S ie g frie d D a ta a s o f 12/6/2021 1
Licensee Support & Education Liquor Unit 1,134 educational contacts 168 hours given 1,707 people received education Cannabis Unit 396 educational contacts 110 hours given 842 people received education Tobacco/Vapor Unit 189 educational contacts 25 hours given 189 people received education Total for November 1,719 educational contacts 303 hours given 2,738 people received education 2
Education Top Ten Educational Topics Subject Number of educational events Regulatory Covid-19 543 328 155 186 63 48 47 41 37 30 Youth access to Liquor Public Safety - Over service Licensing/Permits Youth Access to Cannabis Tobacco Education Education Vapor licensed premises Briefing Advertising 53% of education given was related to public safety topics 3
Enforcement: Complaints November 2021 Summary COVID-19 complaints have over the last quarter been the number one compliant received Met goal of 95% of complaints closed out within 60 days* There were 385 complaints logged with enforcement in the month of November There were 25 complaints against the cannabis industry, 332 in liquor and 28 in tobacco/vapor 75% of complaints were COVID-19 related Days 1-10 11-30 31-60 60+ Closed 68% 25% 6% 1% Division goal is to close out 95% of complaints within 60 days 4 *Data based on last 90 days
Cannabis Complaints 45 45 40 40 35 35 30 30 25 25 20 20 15 15 10 10 5 5 21 21 20 20 18 18 11 11 15 15 25 25 28 28 13 13 14 14 15 15 39 39 23 23 25 25 4 4 6 6 9 9 1 1 6 6 0 0 Cannabis Complaints COVID-19 safety/health complaints are not included in the data 5
Liquor Complaints 250 250 200 200 150 150 100 100 50 50 194 194 104 104 61 61 84 84 83 83 38 38 53 53 48 48 41 41 43 43 98 98 65 65 93 93 65 65 36 36 68 68 58 58 66 66 0 0 Jun-20 Jun-20 Jul-20 Jul-20 Aug-20 Aug-20 Sept Sept Oct-20 Oct-20 Nov-20 Nov-20 Dec-20 Dec-20 Jan-21 Jan-21 Feb-21 Feb-21 Mar-21 Mar-21 Apr-21 Apr-21 May-21 May-21 Jun-21 Jun-21 Jul-21 Jul-21 Aug-21 Aug-21 Sep-21 Sep-21 Oct-21 Oct-21 Nov-21 Nov-21 Liquor Complaints COVID-19 safety/health complaints are not included in the data 6
Tobacco Complaints 45 45 40 40 35 35 30 30 25 25 20 20 15 15 10 10 5 5 21 21 29 29 22 22 40 40 15 15 28 28 17 17 27 27 21 21 13 13 22 22 36 36 28 28 10 10 22 22 26 26 23 23 9 9 0 0 Tobacco/Vapor Complaints COVID-19 safety/health complaints are not included in the data 7
COVID-19 Complaints 1600 100% 1465 94% 93% 1375 90% 90% 1400 87% 83% 1237 80% 79% 77% 1138 1200 75% 75% 70% 1000 922 60% 828 800 50% 50% 675 664 580 40% 545 535 600 34% 442 429 30% 385 335 400 328 286 248 20% 153 147 200 108 10% 78 50 2 1% 0 0% COVID-19 Complaints Total Complaints received Percentage related to COVID-19 COVID-19 safety/health complaints have been on a steady decline since a high in December 2020, but have increased after the latest mandate. 8
AVNS Issued 107 95 90 71 69 52 22 20 19 18 18 15 15 14 11 9 8 5 9% of businesses had a repeat violation in the last 12 months (due in part to businesses getting multiple COVID-19 violations) November Liquor Tobacco/Vapor Cannabis AVNs 89 14 4 9 Division goal is 5%
Alternative Dispute Resolution Liquor 40 34 35 32 30 25 20 13 13 15 10 5 2 1 1 0 0 Uncontested - Paid Straight to Formal Hearing Informal Hearings Fwd to Formal Hearing from Informal November Average Hearings scheduled two weeks out 10
Alternative Dispute Resolution Cannabis 3.5 3 3 3 2.5 2 2 2 2 1.5 1 1 1 0.5 0 Uncontested - Paid Straight to Formal Hearing Informal Hearings Fwd to Formal Hearing from Informal November Average 11
Liquor Compliance Checks 300 100% 95% 250 90% 85% 81% 200 79% 77% 80% 76% 75% 150 75% 70% 70% 100 65% 60% 50 55% 119 285 253 219 232 255 0 0 0 0 0 0 0 0 0 0 0 1 0 50% Liquor Compliance Checks Compliance Rate PREVENT YOUTH ACCESS: Compliance checks restarted in May 2021 Compliance rate for CY2019 85%. (PreCOVID-19) *Delivery compliance checks conducted: 16 checks with 8 sales, resulting in a 50% compliance rate. (data not part of the chart) 12
Cannabis Compliance Checks 80 100% 96% 96% 70 94% 94% 95% 60 90% 87% 50 84% 40 85% 30 80% 20 75% 10 21 33 17 21 69 43 0 0 0 0 0 0 0 0 0 0 0 0 0 70% Cannabis Compliance Rate PREVENT YOUTH ACCESS: Compliance checks restarted in May 2021 Compliance rate for CY2019 96%. (PreCOVID-19) 13
Tobacco and Vapor Compliance Checks 140 100.0% 95.0% 120 90.0% 100 85.0% 80.0% 79% 79% 80.0% 76.3% 80 75.0% 70% 68% 60 70.0% 65% 65.0% 40 60.0% 20 55.0% 104 123 80 20 50 43 33 0 0 0 0 0 0 0 0 0 0 0 0 50.0% Tobacco/Vapor Compliance checks Compliance Rate PREVENT YOUTH ACCESS: Compliance checks restarted in May 2021 Compliance rate for CY2019 91% (PreCOVID-19) 14
Liquor Premises Checks 4000 3500 3000 2500 2000 1500 1000 500 2117 1814 2766 2476 2740 2578 2117 2507 3602 3173 2717 2538 2419 2801 2538 2043 2122 1950 0 Premises Checks Division goal is 100% of licensees visited within two years. Retail and MIW: 18,184 locations 1 Year 2 Years Liquor 53% 74% 15
Cannabis Premises Checks 600 600 500 500 400 400 300 300 200 200 100 100 530 530 279 279 266 266 303 303 245 245 234 234 240 240 221 221 326 326 362 362 345 345 324 324 281 281 422 422 325 325 264 264 218 218 238 238 0 0 Premises Checks Division goal is 100% of licensees visited within two years Retail and Producer/Processers 1,825 locations 1 Year 2 Years 99% Cannabis 77% 16
Tobacco/Vapor Premises Checks 500 500 450 450 400 400 350 350 300 300 250 250 200 200 150 150 100 100 50 50 372 372 381 381 429 429 337 337 360 360 396 396 436 436 349 349 364 364 414 414 307 307 334 334 428 428 311 311 327 327 285 285 355 355 224 224 0 0 Premises Checks Number of licensed locations: 6,352 17