Nuclear Shape Evolution in Lead Region
Explore the nuclear shape evolution in the lead region around the neutron midshell, focusing on mean-square nuclear charge radii and pioneering experiments in the Pb-region. Discover the significance of optical measurements in understanding nuclear structure physics phenomena.

Download Presentation

Please find below an Image/Link to download the presentation.
The content on the website is provided AS IS for your information and personal use only. It may not be sold, licensed, or shared on other websites without obtaining consent from the author. If you encounter any issues during the download, it is possible that the publisher has removed the file from their server.
You are allowed to download the files provided on this website for personal or commercial use, subject to the condition that they are used lawfully. All files are the property of their respective owners.
The content on the website is provided AS IS for your information and personal use only. It may not be sold, licensed, or shared on other websites without obtaining consent from the author.
E N D
Presentation Transcript
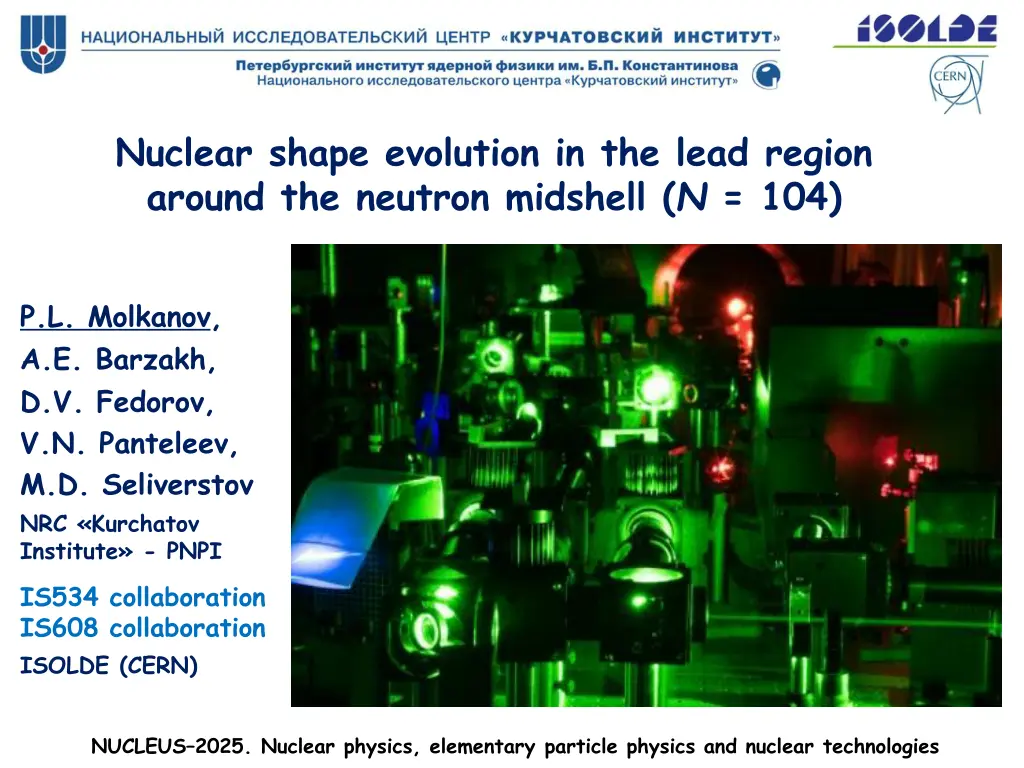
Nuclear shape evolution in the lead region around the neutron midshell (N = 104) P.L. Molkanov, A.E. Barzakh, D.V. Fedorov, V.N. Panteleev, M.D. Seliverstov NRC Kurchatov Institute - PNPI IS534 collaboration IS608 collaboration ISOLDE (CERN) NUCLEUS 2025. Nuclear physics, elementary particle physics and nuclear technologies
Mean-square nuclear charge radii mean-square nuclear charge radius (mscr) Spherical shape: 2 = 0 <r2>0 mscr of a spherical nucleus of identical volume. Usually for the evaluation <r2>0 the Droplet Model is used Prolate deformed shape: 2 > 0 Influence of the nuclear deformation on changing of charge radii: < 2> - quadrupole deformation parameter <r2>A,A - the change in mscr between the two isotopes Oblate deformed shape: 2 < 0 <r2> is very sensitive to changes in the nuclear shape Addition of a neutron at A 100: spherical nuclear shape ?? deformed nuclear shape ?? ? = ?.? ? = ?.? Nuclear charge radii act as sensitive probes of different facets of nuclear structure: shell effects, pairing correlations, nuclear deformation and shape evolution 2 2
Pioneering experiments in Pb-region (Z = 82) Optical measurements in the lead region of 177 186Hg (Z = 80) near the neutron mid-shell at N = 104 Incredible results for the time, but limited by low production rates and low sensitivity of the method This phenomenon was characterized as one of the most remarkable discoveries in nuclear structure physics in the last 50 years . K. Heyde and J. L. Wood, Phys. Scripta 91, 083008 (2016) 3
Motivation for the optical spectroscopy in Pb-region Interpretation of the shape staggering effect in Hg : the ground states of the odd-A isotopes with N < 105 are strongly deformed, whereas, the even-A isotopes remain nearly spherical or weakly deformed Nuclear shape staggering Experimental tasks: to extend of mercury measurements down to 180Hg and beyond to investigate the ground and isomeric states shapes for different elements in Pb-region Experimental challenge The center of Pb-region lies far from stability: low production cross sections overwhelming production of isobaric contaminants very short half lives of most nuclei of interest Conclusion: For experimental investigations in Pb-region should be used the most extreme methods ever developed for far-from-stability nuclear structure study The extension of these measurements down to 180Hg might be made feasible by improving experimental details. It could thus be determined whether the shape staggering extends further, and where the nuclear shape becomes stabilized finally . J. Bonn, G. Huber, H.-J. Kluge, L. Kugler, and E. Otten, Phys. Lett. 38B, 308 (1972) Solution: Measurements at ISOL facilities Using of the optical spectroscopy techniques as very sensitive tool 4
Ion beam production at ISOL facilities ISOL = Isotope Separator On-Line Target Hot Cavity Extractor Ion Source Mass separator ISOL technique step-by-step: Production of the radioactive isotopes in target Ionization in hot cavity Extraction from the target-ion source system Mass separation Transport to experimental setups Laser beams Experiments 30 kV Reaction products (neutral) Projectile (p,n,ions) Target material Ions Surface Ion Source Plasma Ion Source Benefits Drawbacks large production yield rates from the thick targets slow release of the some radioactive products from the target matrix, some elements are irreversibly trapped surface ionization of isobaric contaminants => limited purity of RIB Very efficient, even for high IP elements Chemically unselective efficient surface ionization (for alcali), efficient laser ionization (for volatile) Heated up to 2400 C Ionization efficiency depends on ionization potential Very simple: metal tube from Ta or W Used for non surface ionizing elements 5
Laser Ion Source (LIS) - ionization efficiency Ionization in a hot cavity: The hot cavity concept has been developed with the goal of increasing the ionization efficiency of atoms moving in a vacuum through pulsed laser beams. The geometry of the cavity provides confinement of atoms within the laser beam during the time interval between consecutive laser pulses while the hot environment prevents atoms from absorption on the cavity internal walls Experimental alpha-spectra collected in laser-on and laser-off modes Schematic drawing of the hot cavity LIS (PNPI) 3D model of the hot cavity RILIS (ISOLDE) 1 ionization cavity, 2 target, 3 - laser beams, 4 extractor, 5 - ion beam 6
Laser Ion Source (LIS) - selectivity ?? ??????????? = ???? isobar selectivity after Laser IS Schemes of resonance ionization The position of the excited levels is specific for each element. Laser ionization takes place when the atomic vapor interacts with the laser beams, which are precisely wavelength tuned to the transition energies of a chosen ionization scheme. Only the atoms with an atomic energy level structure that can be resonantly excited by lasers will be ionized. The ionization process is therefore completely element selective 7
Laser Ion Source (LIS) - selectivity By enhancing only one element of interest over a broad range of contaminants, cleaner conditions are reached more accurate studies can be performed 196At 196At RILIS + ISOLDE (IS534) RITU: M.B. Smith et al., J. Phys. G. 26, 787 (2000) 8
Layout of the RILIS setup RILIS = Resonance Ionization Laser Ion Source of the ISOLDE facility at CERN The second (2 ), third (3 ) and fourth (4 ) harmonics of laser beams can be produced with harmonics generation units SHG, THG and FHG, respectively 9
Laser Ion Source (LIS) worldwide Due to its high efficiency and element selectivity Laser Ion Source is nowadays very appropriate at existing or planned ISOL facilities for: radioactive ion beam production atomic and nuclear spectroscopy of rare isotopes produced in very small quantities (less than 1 ion/s) 11
in-source resonance-ionization laser spectroscopy technique Isotope/isomer shift A-1,Z A,Z Laser spectroscopy is able to measure subtle shifts in the energy of the atomic electron levels, arising from changes in the charge distribution of the nucleus. Resonance Ionization Laser Spectroscopy (RIS) relies on the production and detection of photo-ion production rate during a laser scan of the electronic transition. For RIS one of the transitions of the ionization scheme is chosen for laser scanning in a high resolution mode using a narrow-band (NB) laser. In-Source RIS:the scanning procedure is applied directly within the ion source 12
Laser spectroscopy for nuclear physics High-resolution laser spectroscopy is an extremely sensitive method of probing the nuclear ground and metastable states via measurements of isotopic shifts (IS) and hyperfine structure (HFS) of atomic transitions. Deduced nuclear parameters are: changes in the mean-square charge radius r2 A,A0 electric quadrupole moment Qs nuclear spin I magnetic dipole moment 13
Positions of the hfs components on the spectrum in gold (IS 534) + I - nuclear spin, J electronic angular momentum, F the total angular momentum of the atom, a(nl) - magnetic hyperfine coupling constant for the atomic level with the quantum numbers n and l, 0, I0 - magnetic dipole moment and spin of stable 197Au, - magnetic dipole moment K K 0 - position of the center of gravity of the hfs, = , F F 6 ( a ) 6 ( a ) p s 0 2 I 2 J = + ) 1 + ) 1 + ( ) 1 F ( ( K F F I J = + = , 1 + + , | | |, | ... , F I J I J I J I J a I = 0 a I 0 0 Free parameters for the fits: relative ISto the stable 197Au ( A,197= A- 197), magnetic hfs constants - a(6s) and a(6p) 14
Positions of the hfs components on the spectrum in bismuth (IS 608) hyperfine structures for the states with nuclear spins I = 1/2 and I = 9/2 typical for neutron deficient Bi isotopes = + 0 - the position of the center of gravity of the hfs The resolution of in-source RIS is limited by the Doppler broadening , ' 0 ' F F F F + + ) 1 + Free parameters for the fits: relative ISto the stable 209Bi ( A,209), magnetic hfs constants (a1 and a2), electric quadrupole hfs constant (b1) T ionization temperature . 0 75 ( ) 1 ( ) 1 ( ) 1 K 2 K 2 K I I J J = + a b F ( ) 1 2 ( ) 1 2 ( I J I J = + + + , 1 ( ) 1 ( ) 1 K F F I | I J J | 0 - frequency of the atomic transition, A - atomic mass number, = + , = + + , | |, ... , F I J F I J I J I J a b Q 15
Spin assignment 177,179Aug One of the key strengths of high-resolution laser spectroscopy methods is that, in a large number of cases, the nuclear spins can be determined unambiguously in a nuclear model-independent way 177Au Windmill Previously known data: spin of I = (1/2+,3/2+) based on the in-beam study F.G. Kondev et al., Phys. Lett. B 512 (3 4) (2001) 268 179Au MR-ToF I = 1/2: 3 peaks, intensity profile of 1:2:1. I = 3/2: 4 peaks, intensity profile of 5:5:1:5 I (177Aug) = 1/2 I (179Aug) = 1/2 16
Photo-ion detection methods Complementary methods of photo-ion detection are required ! ISOLDE detection systems: Faraday cup The Windmill a-decay spectroscopy setup ISOLTRAP Multireflection Time-of-Flight Mass Separator (MR TOF) The MR-TOF was used for cases where: the isotope of interest was either too long-lived the -decay branching ratio was unfavorable isobaric contamination from surface-ionized isobars were too high 17
Optical and nuclear parameters Hyperfine splitting of the electronic levels: Distance between peaks gives hfs splitting + + ) 1 + . 0 75 ( ) 1 ( ) 1 ( ) 1 K 2 K 2 K I I J J = + a b F ( ) 1 2 ( ) 1 2 ( I J I J = + + + , 1 Shift of the centre of hfs gives isotope shift ( ) 1 ( ) 1 K F F I | I J J | = + , = + + , | |, ... , F I J F I J I J I J a b Q s spectroscopic quadrupole moments Qs static quadrupole deformation 2 Isotopic shift of the electronic levels: Advanced atomic and molecular calculations has been performed for determination of electronic factor F and for evolution of specific mass shift constant MSMS change in mean-square charge radius <r2>A,A static and dynamic quadrupole deformation 2 - experiment - calculations
Before IS534 Experiment (ISOLDE) Main goal: to extend the earlier IS/HFS measurements to the lighter gold isotopes close to and beyond N=104 Au ? What happens to the ground states Influence of the nuclear deformation on changing of charge radii: in the lightest isotopes of gold? Do they remain strongly deformed, or do they return toward sphericity? Main isotopic trend of mscr is described by the Droplet Model. Deviations from the DM trend are attributed to the advance of the mean-square quadrupole deformation 19
IS534 Experiment @ ISOLDE Delineating the island of deformation in the light gold isotopes by means of laser spectroscopy Au 20
Bi, Hg: large shape staggering IRIS, Bi: radii By performing laser-spectroscopy studies of 187 191Bi, we demonstrated a sharp radius increase for 188Big, relative to the neighboring 187,189Big. Fifty years after discovery of shape-staggering in Hg, we have found only the second example of such an unusual behavior, now in the lightest Bi (Z = 83) isotopes with odd number of protons. This dramatic change happens at the same neutron number (N = 105), where the huge shape staggering started in the isotonic 185Hg, and it has the same magnitude 21
Comparison of Q and DM Bi: deformation Influence of the nuclear deformation on changing of charge radii: ??? = ?2 2 1/2 In the strong coupling scheme: In contrast to the mercury isotopes with spin 0 or 1/2 for which Qs 0, for 188Big one can directly check deformation using the measured Qs value. Deformation parameter Q extracted from Qs coincides with DMfrom <r2> and unambiguously testifies to the strong prolate deformation of 188Big 22
Radii in Pb-region near neutron midshell (N = 104) The small changes in N and/or Z in this region lead to the dramatic variations in the pattern of the shape evolution which make these data a stringent test of the theory 23
HFB calculation for Bi The experimental results were analyzed on the basis of HFB calculations with the D1M Gogny interaction and the equal filling approximation for the odd-A and odd-odd nuclei. Potential energy surfaces (PES) were calculated with the blocked quasiparticles (qp) compatible with the experimental spin and parity. For each PES, at least one of the minima has a magnetic moment compatible with experimental data 24
HFB calculation for Bi Comparison between experimental <r2> with HFB calculations (with and without CM) Configuration mixing (CM) E(q) - HFB energy of the PES at deformation q T - parameter which allows mixing between low-lying states Criteria for selecting candidate g.s.: correct the same I Eexcitation< 1 MeV 25
Conclusions Conclusions 1. The laser spectroscopy is a powerful tool of probing the nuclear ground states and isomers that enable to obtain important information about shape evolution and shape coexistence in different regions of the nuclide chart. 2. Our recent in-source spectroscopy studies have shown that the gold, mercury, and bismuth chains display dramatic changes in ground-state deformation near the neutron mid-shell at N = 104. The observed jumps in r2 indicate sudden transitions from near-spherical to strongly deformed configurations. 3. The experimental results are compared to mean-field calculations, that reproduce the unusual behavior of r2 fairly well only when the nuclear ground states are chosen in accordance with experimental spin and magnetic moments rather than the energy of the corresponding levels. This observation reveals the fundamental deficiency of the current mean-field approaches 26
Thank you for listening ! ENGINEERING ENGINEERING DEPARTMENT DEPARTMENT
Conclusions Backup 28
HFB calculation for Au HFB calculations with the D1M Gogny interaction Configuration mixing (CM) E(q) - HFB energy of the PES at deformation q T - parameter which allows mixing between low-lying states Criteria for selecting candidate g.s.: correct correct I Eexcitation< 1 MeV Comparison between experimental <r2> values for gold isotopes with HFB calculations with and without CM 29
Spin assignment 180,182Aug Nuclear spectroscopy data: I (180Aug) 3 I (182Aug) = (2) integration method The theoretical ratio rth, of the sum of the intensities for the transitions mentioned: 182Au: rexp= 1.61(15) for 2 hfs spectra => I = (2) 180Au: rexp= 2.06(20)for 5 hfs spectra => I = (1) Photo-ionization scheme used by RILIS to produce 180,182Au ions 31
The Windmill lpha-decay spectroscopy setup This Windmill geometry allows effective measurements of both singles and coincident particle decays of implanted activity: alpha gamma electrons fission fragments Silicon detectors (Si 1, Si 2) cover a solid angle of 50-66%. Additional detectors (Si 3, Si 4) are placed to study the decay of the longer-lived daughter products. 32


")


 - ionization efficiency")
 - selectivity")
 - selectivity")


 worldwide")


")


")