Nurse and Midwifery Staffing Insights for April 2024
Gain insights into the nursing and midwifery staffing position for April 2024, including vacancy rates, turnover rates, staff availability, and strategies implemented to mitigate staffing risks. Discover key data points and trends that impact the workforce dynamics in healthcare settings.

Download Presentation

Please find below an Image/Link to download the presentation.
The content on the website is provided AS IS for your information and personal use only. It may not be sold, licensed, or shared on other websites without obtaining consent from the author. If you encounter any issues during the download, it is possible that the publisher has removed the file from their server.
You are allowed to download the files provided on this website for personal or commercial use, subject to the condition that they are used lawfully. All files are the property of their respective owners.
The content on the website is provided AS IS for your information and personal use only. It may not be sold, licensed, or shared on other websites without obtaining consent from the author.
E N D
Presentation Transcript
Monthly Nurse Safe Staffing Together Safe Kind Excellent Sponsoring executive director: Lorraine Szeremeta, Chief Nurse Amanda Small, Deputy Chief Nurse Christopher Gray, Lead Nurse Safer Staffing Board of Directors: 19 June 2024
Executive Summary This slide set provides an overview of the Nursing and Midwifery staffing position for April 2024. There has been a reduction in the vacancy rate for Registered Children s Nurses (RSCN s) to 19.1% from 21.1% in March and Health Care Support Workers (HCSW) to 12.5% from 13.8% in March. The vacancy rate has remained relatively static for Registered Nurses (RN s) at 6.4% (6.5% March) and Maternity Care Assistants (MCA) at 4.5% (4.7% March), conversely the vacancy position for Registered Midwives (RM s) has seen a small increase to 1.5% (0.7% in March). The turnover rate in March remains high but is relatively static in all areas with HCSW (including MCA s) at 14.7% (15.6% in March), RNs at 9.7% (9.8% in March) RSCN s at 15% (15.6% in February) and RMs at 10.2% (9.8% in March). The main reason for leaving for all staff groups is voluntary resignation relocation. The leavers destination data demonstrates that 31.5% of RNs and 30% of RMs are leaving to take up employment in other NHS organisations. 20% of RMs are leaving for no employment compared to 8.2% of RNs. Conversely, the leavers destination is unknown for the majority of HCSWs (48%) with 10.8% leaving for no employment. The planned versus actual staffing report demonstrates that 5 clinical areas reported <90% overall rota fill in April (3 in March). The overall fill rate for maternity has decreased to 97.6% compared to 99.6% in March. Any decrease in fill rate within midwifery is mitigated through acuity assessment and redeployment of non-clinical, managerial and specialist staff to cover gaps. Where safety concerns arise the escalation to divert policy is activated to balance risk and maintain safety. During these incidences 1:1 midwifery care is maintained, and supernumerary status of the coordinator is a priority. The total unavailability of the workforce working time in April has decreased to 25.7% (29.3% in March). The majority of unavailability (17.5%) is due to planned annual leave. Sickness absence has decreased in April to 4.6% (6.4% in March). Additionally, 1% of working time was unavailable due to other leave, 1.7% was due to study leave and 0.9% was due to supernumerary time. In order to mitigate staffing risks, the number of requests for bank workers remains high with an average of 2379 shifts per week requested for registered staff and 1907 shifts requested for Health care support workers and Maternity support workers per week with an average bank fill rate of 72% for registered staff and 69% for Health Care Support workers. In addition, the equivalent of 9.83 WTE agency workers are working across the divisions (16.6 WTE in March). Despite this, redeployment of nurses and midwives has remained necessary due to staff unavailability, with an average of 225 working hours being redeployed each day. The number of occasions that 1 critical care nurse has needed to care for more than 1 level 3 patient has decreased in April to 7 occasions compared to 28 in March. Additionally, there have been 92 occasions in April where there has been no side room coordinator (97 in March). Any concerns with regards to critical care staffing are escalated through the senior nurse of the day. Staffing has been supported through the use of temporary workers (agency and bank), enhanced bank rates and registered staff (non critical care trained) are redeployed from the operational pool and clinical areas on a shift-by-shift basis. Critical care have opened 3 of the beds that were closed due to staffing resulting in 55 open beds rather than 59 beds. Recruitment is ongoing to the vacant positions with a plan to open the remaining 4 beds when vacancy allows. 2
Combined Nursing and Midwifery Staffing Position Vacancy Rates Graph 1. Nursing and midwifery vacancy rates Vacancy position The vacancy position reported in April is measured against the budgeted establishment for March 2024 whilst awaiting for the agreed budgets for 24/25 to be aligned to the Electronic staff record (ESR). The combined vacancy rate for Registered Nurses (RN s) and Registered Midwives (RM s) has decreased slightly to 6.1% in April from 6.5% in March. The vacancy rate for Health care support workers (HCSW s) including Maternity Care Assistants (MCA s) has also decreased to 12.1% in April (13.2% in March). When broken down further into Nursing and Midwifery specific vacancies, the HCSW vacancy rate (excl MCA) has reduced to 12.5% in April from 13.6% in March whereas the MCA vacancy rate has remained relatively static at 4.5% (4.7% March). Graph 2. Healthcare Assistant vacancy rates Although the HCSW (including MCA s) turnover rate remains high, it has reduced slightly to 14.7% from 15.6% in March. The main reason for HCSWs leaving is voluntary resignation relocation (30.3%) and the next highest reason is voluntary resignation work life balance (24.3%). The leavers destination is unknown for the majority of HCSWs (48%), 16.2% of HCSW s are leaving to take up employment in other NHS organisations and 10.8% are leaving for no employment. 3
Staffing Position Vacancy Rates for Registered Nurses and Registered Midwives Graph 3. Registered Nurse vacancy rates Vacancy position The vacancy rate for RN s working in adult areas remains relatively static in April at 6.4% (6.5% March), conversely whilst the vacancy rate for registered children's nurses remains high, it has decreased to 19.1% in April from 21.1% in March. As illustrated in graph 4, the vacancy rate for Registered Midwives has increased slightly to 1.5% compared to 0.7% in March. The turnover rate in April remains high at 9.7% for RNs in adult areas (9.8% in March), 10.2% for RMs (9.8% in March) and 15% registered children's nurses (15.6% in March). The main reasons for RMs and RNs leaving is voluntary resignation relocation (36.7% RM s and 39.7% RNs). The leavers destination data demonstrates that 31.5% of RNs and 30% of RMs are leaving to take up employment in other NHS organisations. 20% of RMs are leaving for no employment compared with 8.2% of RNs. Graph 4. Registered Midwife vacancy rates 4
Unavailability for Registered Nurses, Midwives and Health Care Support Workers Graph 5. Unavailability of staff Unavailability of staff Unavailability relates to periods of time where an employee has been given leave from their regular duties. This might be due to circumstances such as annual leave, sick leave, study leave, carers leave etc. As illustrated in graph 5, the total unavailability of the workforce working time in April has decreased to 25.7% from 29.3% in March. Graph 6 illustrates the percentage breakdown of the type of unavailability. This demonstrates that the majority of unavailability (17.5%) was due to planned annual leave which would have been accounted for in the department rosters however there was a high percentage of unplanned leave that would have impacted upon fill rates within the rosters. In April, sickness absence has reduced to 4.6% from 6.4% in March. Supernumerary has reduced to 0.9%, study leave to 1.7% and other leave to 1.0%. Graph 6. Types of absence 5
Planned versus actual staffing Planned versus actual staffing Graph 7 illustrates trend data for all wards reporting < 90% rota fill. The number of areas reporting <90% rota fill for registered RN/RM has increased to 20 in April from 16 in March. The number of areas reporting <90% rota fill for HCSWs in April has increased to 8 from 6 in March. The number of ward areas reporting overall fill rates of <90% in April has increased to 5 compared to 3 in March. Appendix 1. details the exception reports for all areas reporting RN/RM fill rates of <90%. The number of occasions that 1 critical care nurse has needed to care for more than 1 level 3 patient has decreased in April to 7 occasions compared to 28 in March. Additionally, there have been 92 occasions where there has been no side room coordinator (97 in March). Any concerns with regards to critical care staffing is escalated through the senior nurse of the day. Staffing has been supported through the use of temporary workers and registered staff (non critical care trained) are redeployed from the operational pool and clinical areas on a shift-by-shift basis. There was also a short- term agreement to pay critical care trained staff bank enhancements to reduce the overall amount of GPICS breaches. Critical care have opened 3 of the beds that were closed due to staffing resulting in 55 open beds rather than 59 beds. Recruitment is ongoing to the vacant positions with a plan to open the remaining 4 beds when vacancy allows (May and September). Midwifery & MSW fill rate Graph 8 illustrates that the overall fill rate for maternity has decreased to 97.6% in April from 99.6% in March however this is higher than the 12-month average of 93.2%. The lowest fill rates have been seen on Sara Ward (92%) which have been mitigated through redeployment of staff where required to meet acuity needs. 6
Staff deployment Staff deployment Graph 9 illustrates the movement of staff across wards to support safe staffing to ensure patient safety. This includes staff who are moved on an ad hoc basis (shift by shift) and shows which division they are deployed to. The number of substantive staff redeployed has decreased in April with 225.71 working hours being redeployed per day (355 hours in March). This equates to 19.63 long day or night shifts per day. Staffing is also being supported by the operational pool whereby bank staff book a bank shift on the understanding that they will work anywhere in the trust where support is required. Nursing Pipeline Appendix 2 provides detail on the forecasted position in relation to the number of adult RN vacancies based on FTE and includes UK experienced, UK newly qualified, apprenticeship route, EU and international up to March 2025. This data is measured against the establishment for March 2024. The current forecast demonstrates a year end band 5 RN vacancy position of 2.02% which exceeds the target of 5%. Due to the low vacancy rate for band 5 adult RNs, placement of international nurses and newly qualified nurses is becoming challenging. An analysis of trends in unavailability and turnover is being undertaken to inform the allocation of new starters to areas which may take areas over their current funded establishments and will require support from finance colleagues. Appendix 3 provides detail on the forecasted position in relation to the number of Paediatric band 5 RN up to March 2025. Numbers are based on those interviewed and offered positions in addition to planned campaigns. The current forecast demonstrates a year end band 5 Paediatric RN vacancy position of 4.00% (March 2025). There is a pause with recruitment to allow on- boarding with the current increase in new starters. Appendix 4 provides detail on the forecasted position in relation to number of HCSW vacancies up to March 2025 with a predicted year end vacancy rate of 0.57%. Whilst the recruitment pipeline is positive with multiple pipelines including apprenticeship routes, domestic and international recruitment, the predicted numbers are only achievable if the appropriate infrastructure is in place to support. 7
Red flags Red Flags A staffing red flag event is a warning sign that something may be wrong with nursing or midwifery staffing. If a staffing red flag event occurs, the registered nurse or midwife in charge of the service should be notified and necessary action taken to resolve the situation. Nursing red flags Graph 10 illustrates that there has been a decrease in the number of red flags reported with 173 reported in April compared to 250 reported in March. The highest number of red flags reported in April was in relation to an unmet Nursing Skills (68 compared to 69 in March) 1:1 specialling requirement continues to decrease (61 compared with 85 in March). A trust wide improvement project focusing on specialling is being developed to review specialling across the organisation. There has been a reduction in all reportable red flags in April. Maternity red flags The number of maternity red flags has decreased from 165 in March to 151 in April. Graph 11 illustrates the red flags that have been reported with the highest reported being Missed of delay care (43% in April compared to 35% in March). 2 other red flags have also increased Delay of >30 mins between presentation and triage (24.5% in April compared to 22% in March) and Delay of > 6 hrs in transfer to delivery unit during IOL process once ARM is indicated (31.8% in April compared to 28.48% in March). All other red flags have seen a reduction. High numbers of unresolved red flags that cannot be mitigated will trigger escalation to divert policy with actions including:- redeployment of staff to higher acuity areas, seeking support from system for elective work such as caesarean sections and inductions of labour. 8
Safety and Risk Incidents reported relating to staff shortages Graph 12 illustrates the trend in Safety Learning Reports (SLRs) completed in relation to nurse staffing. In April there were 47 incidents reported compared to 56 in March. The majority of the incidents related to staffing levels in March were reported by division C with 21. The highest reporting area being Ward D7 (7). Care hours per patient day (CHPPD) Care hours per patient day (CHPPD) is the total number of hours worked on the roster (clinical staff including AHPs) divided by the bed state captured at 23.59 each day. NHS Improvement began collecting care hours per patient day formally in May 2016 as part of the Carter Programme. All Trusts are required to report this figure externally. Graph 13: Care Hours Per Patient Day (CHPPD) CUH CHPPD recorded for April has increased to 9.56 from 8.52 in March, this is slightly above the other Shelford hospitals (9.3). In maternity, from 1 April 2021, the total number of patients now includes babies in addition to transitional care areas and mothers who are registered as a patient. CHPPD for the delivery unit in April has increased to 14.7 (13.48 in March). 9
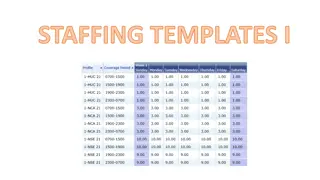
Bank Fill Rate and Agency Usage Graph 14 Registered RN/RM Bank fill rate per week Bank fill rate The Trust s Staff Bank continues to support the clinical areas with achieving safe staffing levels. Graph 14 and 15 illustrate the trends in bank shift fill rate per week. Overall, we have seen a decrease in April for bank shift requests for registered staff to mitigate those areas who have less than a rota fill of 90% or to cover an unmet specialling need. The number of requests for registered staff is an average of 2379 shifts per week with an average bank fill rate of 72%. The number of requests for Health care support workers and Maternity support workers remains high with an average of 1907 shifts per week with an average bank fill rate of 72% this is an increase from 69% in April. In addition to bank workers, we have the equivalent of 9.83 WTE agency workers working (16.6WTE in March) across the divisions to support staffing challenges in the short. This agency usage had been reducing but to support the emergency department, critical care and opening additional beds within reconfiguration there has been a need to increase to support safe staffing. The use of agency staff is monitored through the bank enhancement meeting and reduced as safe staffing allows. Graph 15 HCSW/MSW bank fill rate per week Short term pay enhancements for bank shifts have been put in place to support staff being deployed. Any bank enhancements in place are reviewed regularly (at least on a 6-weekly basis) through the weekly bank enhancement meeting and are for fixed periods of time. There is also a reducing trend in the use of bank enhancements which will continue to decrease as the vacancy decreases. 10
Appendix 1: Exception report by Division Apr-24 Unit Speciality % fill % fill care staff Overall filled % CHPPD Analysis of gaps Impact on Quality / outcomes Actions in place registered 9 OSCE RNs working as band 3s a/w pin. No Mat leave Down 1 LD RN each shift, x5 lates down 2 RN but with patient numbers this may equate to 1 RN gap (D8 has ring fenced elective beds). Supervisory time used as mitigation frequently in month. Down 1 RN most nights with ratio of 1:8.1:9 - will depend on actual patients numbers 1) Incidents- 24 in month which is above mean but under UCL of 28. x4 moderate harm for HAPUs- team working with IHI re: HAPU QI project. x2 fall (below thei rmean) either low or no harm. x1 cardiac arrest and review by Resus found no ommissions in care in a patient with a valid DNACPR 2) complaints- nil 3) Supervisory sisters time = 10.9% 4) Red flags- 24, 14 relate to 1:1 specialling (ward will prioritise 1:1 pts reducing HCA availble to the ward) 1) Incidents 11 incidents all low or no harm and under mean for ward. x1 fall (intentional), no HAPU no failure to escalate high NEWS 2) complaints- x1 related to pt care but also cancellation of surgery- complaint under review currently. 3) Supervisory sisters time = 18.7 % (annual leave impacted this %) 4) Red flags 11- even mix of skill mix and 1:1 special gap (ward will prioritise 1:1 pts reducing HCA availble to the ward) 1) Incidents - 13 incident in month (under mean) all low or no harm. Falls remain at 4 (mean 3), x1 Pressure ulcer (but present on admission). X1 C-diff case reproted during month 2) complaint x1 related to Reverse abording- acton plan in place to support ward and feeding into trust wide improvement project 3) Supervisory sisters time- 81% 4) Red flags 10- majority relate to 1:1 specialling (ward will prioritise 1:1 pts reducing HCA availble to the ward) 8:15 & 16:15 Nursing bronze with band 7 and Matron oversight. Escacaltion to site safety. Mitigation in place within division when staffing allows. Matron of the day for division for support and escalation. T&O specialty PDN supporting 8.57 D8 85% 156% 113% 100 - GENERAL SURGERY A 6 OSCE RNs workign as band 3s a/w pin. X2.5 band 6 vacancies. No Mat leave 8:15 & 16:15 Nursing bronze with band 7 and Matron oversight. Escacaltion to site safety. Mitigation in place within division when staffing allows. Matron of the day for division for support and escalation. PD Team supproting Result down 1 RN E and/or L and down 1 RN 50% of the night in month meanign ward team workin at 1:8 ratio. Supervisory time used as part mitigation 7.05 L4 A 88% 115% 97% 100 - GENERAL SURGERY 3 OSCE RNs workign as band 3s a/w pin. X2 Mat leave, 1 on secondment 8:15 & 16:15 Nursing bronze with band 7 and Matron oversight. Escacaltion to site safety. Mitigation in place within division when staffing allows. Matron of the day for division for support and escalation. PD team supporting Down E and or late ~50% time, band 7 has remained supervisory and significant time spent supporting ward Result down 1 RN for ~1/3 of night shifts meaning that ward team workign at 1:8 ratio 6.93 M4 A 110 - TRAUMA & ORTHOPAEDICS89% 109% 96% 11
Apr-24 Unit Speciality % fill % fill care staff Overall filled % CHPPD Analysis of gaps Impact on Quality / outcomes Actions in place registered 4 OSCE RNs working as band 3s, x2 RNS on mat leave returnign end of June- bank enhancements in place. Dedicated PDN to supprot induction and trianing of new starters. 1) incidnets: HAPU x1 moderate. Falls 4 in total. x1 Moderate, ongoing work with Fall team. Usually ~35 inicdents reported each month,April = 13 (security incidents minimal this month which accounted for a numbe rof incidents previsou month). 2) complaints x1 related to recognitiion of dying- complaint under review team linking in with EOL eductor for addition support and training 3) Supervisory sister time = 71.9% (highest in the last 12 months) 4) Red flags- 7 red flags even mix of skill mix and 1:1 special gap (ward will prioritise 1:1 pts reducing HCA availble to the ward) 8:15 & 16:15 Nursing bronze with band 7 and Matron oversight. Escacaltion to site safety. Mitigation in place within division when staffing allows. Matron of the day for division for support and escalation. Dedicated PDN for U2 Result down 1 RN E and/or L most shifts, x5 occasions when down >2 RNs. Band 7 supervisory time used to support ward x1 when workign in the numbers. x1 QSIS for 11th April related to x3 RN gap on late- bleepholder and Matron supporting ward. x5 NDs when ward down by 1: meaning woring at 1:8.6 ratio and ward lay out means x1 RN works across two sides of the ward. 6.97 U2 A 110 - TRAUMA & ORTHOPAEDICS85% 91% 87% strong recruitment pipeline and vacancy trajectory, predominatly dependent upon overseas recruitment, hence lag. All vacancies appointed to but not in the next few months Divisional change to hand hygiene audits - validated across business units to address compliance Protected matron time in place every day/monthly quality audits/action plans Increased nurse to pt ratio, delays to delivery of care Gap due to RN vacancies, mitigated in part by bank in short term. April 24.3% RN vacancy 9.55 U3 Haematology 90% 103% 94% 823 - HAEMATOLOGY B Incidents - No increase overall. x NQM - No hand hygiene audit completed, EWS p , w improvement = BCMA compliance, blood administration scanning. Catheter = Complaints - x 3 Supervisory B7 time - 5 shifts converted to be clinical Red flags - None 2.31 wte vacancies with an additional 4.0 wte 'non- effective' RNs 7.67 C5 86% 122% 101% 361 - NEPHROLOGY C 12
Apr-24 Unit Speciality % fill % fill care staff Overall filled % CHPPD Analysis of gaps Impact on Quality / outcomes Actions in place registered Incidents - Slight increase in overall incidents reported from 21 to 23. Higher number of falls (x7), 1 x moderate harm for care of a deteriorating patient and 1 for a ward closure due to CPE outbreak. NQM - No hand hygiene audit completed, Red areas = BCMA compliance, blood administration scanning. Complaints - x 1 Supervisory B7 time - 6 shifts converted to be clinical Red flags - 12 (locally reportable) Incidents - Slight increase in overall incidents reported from 27 to 28 with higher falls (x 5) NQM - Red areas = BCMA compliance. Complaints - x 2 Supervisory B7 time - 3 shifts converted to be clinical Red flags - 3 (1 NHSi reportable omission of medication) Incidents - Increase in incidents reported from 6 to 14. NQM - Red area with no improvement = BCMA scanning. Supervisory B7 time - B7 on AL and temporarily redeployed in the month Red flags - 1 (1 NHSi reportable for delay in pain relief) Incidents - No increase overall NQM - No hand hygiene audit completed. Amber to Red area = NEWS2 compliance. Red flags - 4 (locally reportable) All vacancies appointed to but not starting until September HON request (06/05) for matrons to support patient care re; red flags Divisional change to hand hygiene audits - validated across business units to address compliance Protected matron time in place every day/monthly quality audits/action plans 4.0 wte 'non-effective' RNs (3 on secondments and 1 Mat leave) 7.16 D5 86% 137% 101% 301 - GASTROENTEROLOGY C All vacancies appointed to with 2 starting in July HON request (06/05) for matrons to support patient care re; red flags Protected matron time in place every day/monthly quality audits/action plans 2.0 wte vacancies with an additional 4.0 wte 'non- effective' RNs 7.27 EAU 5 85% 111% 94% 300 - GENERAL MEDICINE C All vacancies appointed to HON request (06/05) for matrons to support patient care re; red flags Band 7 moved to support ward from May Protected matron time in place every day/monthly quality audits/action plans 2.77 wte vacancies with an additional 3.0 wte 'non- effective' RNs 7.49 F4 83% 106% 92% 300 - GENERAL MEDICINE C HON request (06/05) for matrons to support patient care re; red flags Divisional change to hand hygiene audits - validated across business units to address compliance Protected matron time in place every day/monthly quality audits/action plans 17.87 F5 87% 88% 100 - GENERAL SURGERY C 13
Apr-24 Unit Speciality % fill % fill care staff Overall filled % CHPPD Analysis of gaps Impact on Quality / outcomes Actions in place registered Incidents - 4 x HAPU (2 Cat 2+). NQM - Red areas = BCMA scanning, M&H, Nutrition screening. Amber to Red areas = IV access & pain score. Complaints - x 1 Supervisory B7 time - 7 shifts converted to be clinical Incidents - No overall increase. 1 x fall. NQM - Red areas = BCMA scanning Supervisory B7 time - B7 on AL and temporarily redeployed in the month Red flags - 19, ward has higher monthly reporting rate (18 locally reportable, 1 NHSi reportable for shortfall in RN staffing)) Incidents - v . x x moderate harm), 1 x extravasation injury. NQM - Red areas = BCMA compliance, blood . Complaints - x 3 Supervisory B7 time - 6 shifts converted to be clinical Red flags - 2 (locally reportable) Protected matron time in place every day/monthly quality audits/action plans 6.0 wte 'non-effective' RNs (2 Mat leave, 4 doing OSCE's) 7.16 F6 89% 126% 106% 430 - GERIATRIC MEDICINE C B7 from F5 providing cover across both wards from may Protected matron time in place every day/monthly quality audits/action plans 6.90 G5 88% 112% 95% 100 - GENERAL SURGERY C HON request (06/05) for matrons to support patient care re; red flags Protected matron time in place every day/monthly quality audits/action plans No vacancies but 11.0 wte 'non-effective' (7 on mat leave) 9.78 N2 86% 127% 100% 300 - GENERAL MEDICINE C All vacancies appointed to Divisional change to hand hygiene audits - validated across business units to address compliance Protected matron time in place every day/monthly quality audits/action plans Incidents - No increase in incidents reported. NQM - No hand hygiene audit completed. Red areas = BCMA scanning,nutrition screening Complaints - x 1 Supervisory B7 time - 5 shifts converted to be clinical No vacancies but 7.0 wte 'non-effective' (3 on mat leave, 4 doing OSCE's) 7.72 N3 87% 96% 90% 340 - RESPIRATORY MEDICINE C 14
Apr-24 Unit Speciality % fill % fill care staff Overall filled % CHPPD Analysis of gaps Impact on Quality / outcomes Actions in place registered Regular assessment by manager of the day & matron to ensure service requirements are met. Daily divisional mitigation; site safety escalation; weekly prospective staffing reporting and mitigation; divisional recruitment and retention strategy. Matron quality focus PD supporting ward manager with junior staff in completing and achieving Nursing competencies, interim Bank Enhancement to attract vacancy fill PD supporting ward manager with junior staff in completing and achieving Nursing competencies, interim Bank Enhancement to attract vacancy fill Daily divisional mitigation; site safety escalation; weekly prospective staffing reporting and mitigation; divisional recruitment and retention strategy. Matron quality focus regular reviews of staffing levels & patient acuity. Divisional support and staff redeployment where required to ensure safe staffing levels 10.40 A5 can be dependent on sickness levels, acuity and bank fill rate (or lack of bank fill) 85% 149% 115% 150 - NEUROSURGERY Staffing reviewed to ensure safe care, Staff moved within service to provide safe staffing D 8.61 J2 89% 93% 91% 150 - NEUROSURGERY can be dependent on sickness levels, acuity and bank fill rate (or lack of bank fill) D No Impact on NQM No Impact on NQM but Junior staff will need close supervision and support from senior sister and junior sisters and charge nurse 5.96 K3 86% 114% 96% 320 - CARDIOLOGY can be dependent on sickness levels, acuity and bank fill rate (or lack of bank fill) D No Impact on NQM but Junior staff will need close supervision and support from senior sister and junior sisters and charge nurse 7.59 L5 Vascular 84% 146% 104% 300 - GENERAL MEDICINE can be dependent on sickness levels, acuity and bank fill rate (or lack of bank fill) D 8.59 LEWIN 90% 128% 102% 328 - STROKE MEDICINE can be dependent on sickness levels, acuity and bank fill rate (or lack of bank fill) D No Impact on NQM 171 - PAEDIATRIC SURGERY 19.75 F3 COU 89% 99% 93% 3.34 WTE RN vacancy currently, Pipeline in 6.0WTE. 1.05WTE HCA vacancy, 0.8WTE pipeline in. E No impact on NQM 15
Appendix 2: Adult RN Recruitment pipeline Adult band 5 RN position based on predictions and established FTE (60% of graduates) Nursing Associates Anglia Ruskin NQ Promotions and transfer out of scope- retained by the trust Return to Practice UK based exp. Vacancy rate based on established FTE No. of vacancies based on established FTE applicants Other NQ ESR Starter leaver variance Overseas Total New Starters Staff in post FTE NAP Month Leavers FTE Establishme nt FTE 12 9 66 8 6 1 2 2 2 2 1 1 1 1 1 28 1 1 62 31 367 31 27 24 18 10 10 75 42 554 41 33 25 23 12 12 91 14 18 158 18 11 143 1760 1773 1773 1788 1796 1796 1794 1781 1768 1834 1818 1802 1788 1771 1780 1780 1805 1805 1805 1816 1816 1816 1816 1816 1816 1816 1816 1816 1816 1816 1816 1816 2.50% 1.79% 1.79% 1.58% 1.14% 1.14% 1.25% 1.97% 2.69% -0.95% -0.07% 0.81% 1.58% 2.52% 2.02% 2.02% 45 32 32 29 21 21 23 36 49 -17 -1 15 29 46 37 37 61 Feb-24 Mar-24 TOTAL Apr-24 May-24 Jun-24 Jul-24 Aug-24 Sep-24 Oct-24 Nov-24 Dec-24 Jan-25 Feb-25 Mar-25 TOTAL 1 23.83 340 32.6 33 13 2 0 19 0 8 9 13 13 13 13 13 13 13 13 13 13 13 12 12 12 12 12 12 12 12 12 12 12 141 20 12 10 -1 -1 78 -4 -4 -2 -5 21 3 40 8 2 34 5 8 8 8 5 5 9 9 2 11 8 34 317 2 20 63 8 18 4 34 2 159 151.4 156.6 16
Appendix 3: Paediatric RN Paediatric band 5 RN position based on predictions and established FTE Nursing Associate 4 3 0 0 17 4 1 4 2 2 5 2 9 2 2 2 2 2 2 9 5 27 Promotions and transfer out of scope- retained by the trust Anglia Ruskin NQ UK based exp. Leavers FTE (based on leavers in the last 12 months) Vacancy rate based on established FTE No. of vacancies based on established FTE Apprentice applicants Other NQ ESR Starter leaver variance Overseas Total New Starters FTE Staff in post FTE NAP Month Establishme nt FTE 1 1 3 4 3 2 1 1 187 188 188 194 191 191 190 189 194 232 231 230 229 228 227 237 237 237 237 237 237 237 237 237 237 237 237 237 237 237 237 20.97% 20.55% 20.55% 17.95% 19.22% 19.22% 19.64% 20.06% 17.95% 1.88% 2.30% 2.73% 3.15% 3.57% 4.00% 4.00% 50 49 49 42 45 45 46 47 42 4 5 6 7 8 9 9 0 2 2 Feb-24 Mar-24 TOTAL Apr-24 May-24 Jun-24 Jul-24 Aug-24 Sep-24 Oct-24 Nov-24 Dec-24 Jan-25 Feb-25 Mar-25 TOTAL 10 8 21 1 2 50 13 1 4 3 3 9 42 3 3 3 3 3 90 37 13 2 1 1 1 1 1 1 1 1 1 1 1 13 13 -2 1 0 0 6 39 0 0 0 0 0 0 3 3 3 3 3 3 3 3 3 3 3 1 1 2 1 1 1 1 1 1 20 10 18 21 10 33 227.05 17
Appendix 4: Band 2 HCSW Recruitment pipeline Band 2 HCSW position based on predictions and established FTE Apprenticeship Vacancy rate based on established FTE 14.40% 13.40% 13.40% 12.53% 11.36% 10.40% 9.89% 9.74% 6.47% 5.96% 5.45% 4.94% 4.65% 4.72% 0.57% 0.57% No. of vacancies based on established FTE (direct entry) Apprentices UK based Associate applicants Nursing ESR Total New Starters FTELeavers FTEStaff in post Month Establishme nt FTE FTE 25 27 256 31 29 26 20 15 20 20 20 20 20 12 20 3 1 28 28 290 31 29 26 20 15 70 20 20 20 20 12 70 14 14 147 1168 1181 1181 1193 1209 1222 1229 1231 1285 1292 1299 1306 1310 1309 1366 1366 1364 1364 1364 1364 1364 1364 1364 1364 1374 1374 1374 1374 1374 1374 1374 1374 196 183 Feb-24 Mar-24 TOTAL Apr-24 May-24 Jun-24 Jul-24 Aug-24 Sep-24 Oct-24 Nov-24 Dec-24 Jan-25 Feb-25 Mar-25 TOTAL 19 15 182.79 170.9 154.9 141.9 134.9 132.9 88.9 81.9 74.9 67.9 63.9 64.9 8 13 13 13 13 16 13 13 13 16 13 13 50 50 100 7.9 7.9 253.1 0 353.1 157.3 18