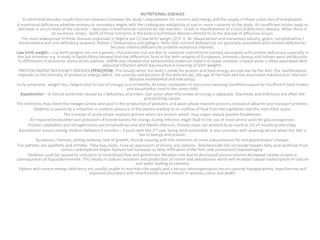
Nutritional Status on Dialysis Trends
Explore the distribution of serum albumin levels among hemodialysis (HD) and peritoneal dialysis (PD) patients from 2012 to 2022. The data shows variations in albumin levels and proportions of patients with specific albumin ranges over the years, providing insights into the nutritional status of dialysis patients.

Download Presentation

Please find below an Image/Link to download the presentation.
The content on the website is provided AS IS for your information and personal use only. It may not be sold, licensed, or shared on other websites without obtaining consent from the author. If you encounter any issues during the download, it is possible that the publisher has removed the file from their server.
You are allowed to download the files provided on this website for personal or commercial use, subject to the condition that they are used lawfully. All files are the property of their respective owners.
The content on the website is provided AS IS for your information and personal use only. It may not be sold, licensed, or shared on other websites without obtaining consent from the author.
E N D
Presentation Transcript
CHAPTER 4 NUTRITIONAL STATUS ON DIALYSIS Thong Kah Mean Fairol Huda binti Ibrahim Norleen Zulkarnain Sim
Table 4.1.1: Distribution of serum albumin, HD patients, 2012 Table 4.1.1: Distribution of serum albumin, HD patients, 2012- - 2022 2022 Number of % patients % patients % patients % patients Year Mean SD Median LQ UQ patients 49674 49084 47370 44243 41315 39886 35955 33443 30732 27406 24125 <30g/L 5 4 5 5 5 5 6 5 5 5 4 30-<35g/L 16 15 15 15 15 16 16 16 15 14 13 35-<40g/L 41 40 39 39 39 40 41 40 40 41 40 40g/L 37 41 40 41 41 39 37 38 40 41 43 2022 2021 2020 2019 2018 2017 2016 2015 2014 2013 2012 38.1 38.5 38.3 38.4 38.4 38.3 38.1 38.1 38.5 38.6 38.7 4.7 4.7 4.7 4.9 4.9 5.3 5.1 5.1 5.1 5.1 5.2 38.7 39 38.9 39 39 38.8 38.7 38.8 39 39 39.2 35.6 36 35.8 35.8 35.8 35.6 35.4 35.5 35.8 36 36.2 41.2 41.6 41.6 41.6 41.6 41.4 41.2 41.3 41.6 41.6 41.7
Figure 4.1.1: Cumulative distribution of serum albumin, HD Figure 4.1.1: Cumulative distribution of serum albumin, HD patients, 2012 patients, 2012- -2022 2022 2014 2020 2016 2022 2018 1 Cumulative Distribution .75 .5 .25 0 20 25 30 35 40 45 50 Serum albumin (g/L)
Table 4.1.2: Distribution of serum albumin, PD patients, 2012 Table 4.1.2: Distribution of serum albumin, PD patients, 2012- - 2022 2022 % patients % patients % patients % patients Number of patients 7370 7085 6416 5841 5359 4982 4520 4197 3603 3160 2776 Media n 32 32.8 32.8 32.7 32.8 33.1 32.9 33 32.9 33.3 32.8 Year Mean SD LQ UQ <30g/L 36 32 32 34 33 31 33 31 31 29 32 30-<35g/L 32 32 32 30 30 30 29 30 33 31 32 35-<40g/L 23 26 26 26 25 27 26 27 25 28 26 40g/L 9 10 10 11 11 12 13 12 11 12 10 2022 2021 2020 2019 2018 2017 2016 2015 2014 2013 2012 31.8 32.3 32.3 32.3 32.3 32.8 32.6 32.7 32.6 33 32.6 6.4 6.3 6.5 6.5 6.5 6.9 6.9 6.7 6.9 6.7 6.7 27.8 28.6 28.4 28.3 28.1 28.8 28.3 28.7 28.7 29 28.6 36.1 36.6 36.5 36.8 36.8 37.2 37.2 37.3 36.9 37.3 36.5
Figure 4.1.2: Cumulative distribution of serum albumin, PD Figure 4.1.2: Cumulative distribution of serum albumin, PD patients, 2012 patients, 2012- -2022 2022 2014 2020 2016 2022 2018 1 Cumulative Distribution .75 .5 .25 0 20 25 30 35 40 45 50 Serum albumin (g/L)
Table 4.1.3: Variation in proportion of patients with serum Table 4.1.3: Variation in proportion of patients with serum albumin albumin 40g/L among HD centres 2012 40g/L among HD centres 2012- -2022 2022 95th centile 71 73 73 73 72 71.5 72 71 73 73 74 Number of centers 846 815 781 756 736 720 696 671 639 598 542 5thcentile Year Min LQ Median UQ Max 2022 2021 2020 2019 2018 2017 2016 2015 2014 2013 2012 0 0 0 0 0 0 0 0 0 0 0 2 2 2 3 2 3 3 2 3 5 4 23 24 22 28 29 23 23 25 24 24 26 38 43 44 44 42.5 40 38 39 42 41 42 53 56 58 58 57 53 50 53 56 55 57 90 98 96 92 93 93 89 90 92 100 94
Figure 4.1.3: Variation in proportion of patients with serum Figure 4.1.3: Variation in proportion of patients with serum albumin albumin 40g/L, HD centres 2022 40g/L, HD centres 2022 % with serum albumin >=40g/L (lower 95% CI, upper 95% CI) 100 80 60 % Patients 40 20 0 0 50 100 150 200 250 300 350 400 450 500 550 600 650 700 750 800 850 Centre
Table 4.1.4: Variation in proportion of patients with serum Table 4.1.4: Variation in proportion of patients with serum albumin albumin 40g/L among PD centres 2012 40g/L among PD centres 2012- -2022 2022 95th centile 29 32 30 37.5 31.5 36 33 31 36 32 37 Number of centers 50 47 43 40 40 38 36 35 32 28 27 5thcentile Year Min LQ Median UQ Max 2022 2021 2020 2019 2018 2017 2016 2015 2014 2013 2012 0 0 0 0 0 0 0 0 0 0 0 0 0 0 0 0 0 0 0 0 0 0 1 2 3 1 0 2 5.5 8 8 9 10 10.5 10 12 12.5 9 11 13 16 15 16.5 18 19 21 22 19 21.5 20 37 42 54 50 40 42 38 37 65 38 43 3.5 1 3 2 3
Figure 4.1.4: Variation in proportion of patients with serum Figure 4.1.4: Variation in proportion of patients with serum albumin albumin 40g/L, PD centres 2022 40g/L, PD centres 2022 % with serum albumin >=40g/L (lower 95% CI, upper 95% CI) 100 80 60 % Patients 40 20 0 0 2 4 6 8 101214161820222426283032343638404244464850 Centre
Table 4.2.1: Distribution of BMI, HD patients, 2012 Table 4.2.1: Distribution of BMI, HD patients, 2012- -2022 2022 % % % Number of patients patients patients patients Year Mean SD Median LQ UQ <18.5 5 5 5 6 6 6 6 6 6 6 7 18.5-25 42 42 43 44 45 46 47 47 47 48 49 >=25 52 53 52 50 50 49 48 48 47 46 45 2022 2021 2020 2019 2018 2017 2016 2015 2014 2013 2012 46251 46221 44721 42427 40009 39054 30428 28108 25691 22606 19582 25.9 26 25.8 25.7 25.6 25.6 25.4 25.5 25.3 25.2 25 5.8 5.8 6.2 6.4 6.5 7.8 6.5 6.9 5.9 5.9 6.2 25.3 25.4 25.2 25 24.9 24.9 24.7 24.7 24.7 24.5 24.4 22.2 22.3 22.2 22.1 22 21.9 21.9 21.9 21.8 21.6 21.5 28.8 28.9 28.7 28.5 28.3 28.3 28.1 28.1 28.1 27.8 27.7
Figure 4.2.1: Cumulative distribution of BMI, HD patients, 2012 Figure 4.2.1: Cumulative distribution of BMI, HD patients, 2012- - 2022 2022 2014 2020 2016 2022 2018 1 Cumulative Distribution .75 .5 .25 0 14 16 18 20 22 24 BMI (kg/m2) 26 28 30 32 34 36 38
Table 4.2.2: Distribution of BMI, PD patients, 2012 Table 4.2.2: Distribution of BMI, PD patients, 2012- -2022 2022 % % % Number of patients patients patients patients Year Mean SD Median LQ UQ <18.5 8 8 9 9 9 10 10 11 11 12 14 18.5-25 43 43 45 44 45 46 48 45 47 46 46 >=25 48 49 46 47 45 44 43 44 43 42 40 2022 2021 2020 2019 2018 2017 2016 2015 2014 2013 2012 5303 5293 4967 4684 4304 4029 3415 3038 2689 2300 1338 25.4 25.4 25.1 25 24.9 24.8 24.7 24.7 24.5 24.5 24.2 8.8 6.5 6.5 6 6.1 6.3 6.8 5.8 5.7 6.1 8.1 24.8 24.9 24.6 24.6 24.5 24.2 24.2 24.3 24.1 24.1 23.8 21.7 21.8 21.5 21.5 21.3 21.1 21 21.1 21 20.8 20.5 28.1 28.3 28 28 27.8 27.7 27.4 27.5 27.4 27.7 27
Figure 4.2.2: Cumulative distribution of BMI, PD patients, 2012 Figure 4.2.2: Cumulative distribution of BMI, PD patients, 2012- - 2022 2022 2014 2020 2016 2022 2018 1 Cumulative Distribution .75 .5 .25 0 14 16 18 20 22 24 26 28 30 32 34 BMI (kg/m2)
Table 4.2.3: Variation in proportion of patients with BMI Table 4.2.3: Variation in proportion of patients with BMI 18.5 kg/m kg/m2 2 among HD centres 2012 among HD centres 2012- -2022 18.5 2022 Number of centers 831 794 768 750 728 717 631 594 571 520 464 5thcentile 95thcentile Year Min LQ Median UQ Max 2022 2021 2020 2019 2018 2017 2016 2015 2014 2013 2012 20 33 27 14 9 27 13 0 6 72 8 87 89 87 86 85 86 86 86 84 83 83 93 93 93 92 92 92 92 92 92 91 91 96 96 95 95 95 95 95 95 95 95 94 98 98 98 98 97 98 98 98 98 98 98 100 100 100 100 100 100 100 100 100 100 100 100 100 100 100 100 100 100 100 100 100 100
Figure 4.2.3: Variation in proportion of patients with BMI Figure 4.2.3: Variation in proportion of patients with BMI 18.5 kg/m kg/m2 2among HD centres 2022 among HD centres 2022 18.5 % with BMI >=18.5 (lower 95% CI, upper 95% CI) 100 90 80 70 % Patients 60 50 40 30 20 10 0 50 100 150 200 250 300 350 400 450 500 550 600 650 700 750 800 850 Centre
Table 4.2.4: Variation in proportion of patients with BMI Table 4.2.4: Variation in proportion of patients with BMI 18.5 kg/m kg/m2 2among PD centres 2012 among PD centres 2012- -2022 18.5 2022 95th centile 97 98 97 97 100 98 100 96 98 97 100 Number of centers 47 46 41 37 37 35 34 31 30 22 18 5thcentile Year Min LQ Median UQ Max 2022 2021 2020 2019 2018 2017 2016 2015 2014 2013 2012 8 14 19 10 7 5 0 13 4 5 9 21 26 25 19 13 8 9 16 13 23 9 89 91 90 88 89 86 83 81 82 81 73 94 93 93 91 92 90 91 89 90.5 90 91 95 96 95 96 95 95 95 94 94 94 94 100 100 100 100 100 98 100 98 98 100 100
Figure 4.2.4: Variation in proportion of patients with BMI Figure 4.2.4: Variation in proportion of patients with BMI 18.5 kg/m kg/m2 2 among PD centres 2022 among PD centres 2022 18.5 % with BMI >=18.5 (lower 95% CI, upper 95% CI) 100 90 80 70 60 % Patients 50 40 30 20 10 0 2 4 6 8 10 12 14 16 18 20 22 24 26 28 30 32 34 36 38 40 42 44 46 Centre
Table 4.2.5: Variation in proportion of patients with BMI Table 4.2.5: Variation in proportion of patients with BMI 18.5 and serum albumin and serum albumin 40 g/dL among HD centres 2012 40 g/dL among HD centres 2012- -2022 18.5 2022 95th centile 69 71 71 73 70 70 69 69 71 72 73 Number of centers 825 790 767 748 725 716 627 593 567 512 457 5thcentile Year Min LQ Median UQ Max 2022 2021 2020 2019 2018 2017 2016 2015 2014 2013 2012 0 0 0 0 0 0 0 0 0 0 0 2 2 2 2 1 2 3 2 3 5 4 22 25 21 27 27 22 21 24 24 24 26 37 43 43 43 41 38.5 37 38 41 39 40 52 55 56 57 54 52 49 52 53 53 56 87 93 93 88 91 89 92 92 89 100 88
Figure 4.2.5: Variation in proportion of patients with BMI Figure 4.2.5: Variation in proportion of patients with BMI 18.5 kg/m kg/m2 2 and serum albumin and serum albumin 40 g/dL among HD centres 2022 40 g/dL among HD centres 2022 18.5 % with BMI >= 18.5 & ALB >= 40 (lower 95% CI, upper 95% CI) 100 90 80 70 60 % Patients 50 40 30 20 10 0 50 100 150 200 250 300 350 400 450 500 550 600 650 700 750 800 Centre
Table 4.2.6: Variation in proportion of patients with BMI Table 4.2.6: Variation in proportion of patients with BMI 18.5 and serum albumin and serum albumin 40 g/dL among PD centres 2012 40 g/dL among PD centres 2012- -2022 18.5 2022 Number of centers 47 46 41 37 37 35 34 31 30 22 18 5thcentile 95thcentile Year Min LQ Median UQ Max 2022 2021 2020 2019 2018 2017 2016 2015 2014 2013 2012 0 0 0 0 0 0 0 0 0 0 0 0 0 0 0 0 0 0 0 0 0 0 1 1 2 0 0 1 1 1 0 1 6 5 13 13 13 16 14 16 17 17 18 18 17 25 27 28 30 28 27 30 24 36 28 41 31 40 31 35 29 27 36 30 65 35 41 6.5 6 6 9 9 8 11 11.5 5.5 13
Figure 4.2.6: Variation in proportion of patients with BMI Figure 4.2.6: Variation in proportion of patients with BMI 18.5 kg/m kg/m2 2and serum albumin and serum albumin 40 g/dL among PD centres 2022 40 g/dL among PD centres 2022 18.5 % with BMI >= 18.5 & ALB >= 40 (lower 95% CI, upper 95% CI) 100 80 60 % Patients 40 20 0 1 3 5 7 9 11 13 15 17 19 21 23 25 27 29 31 33 35 37 39 41 43 45 47 Centre
Table 4.3.1: Nutritional parameters between HD and PD Table 4.3.1: Nutritional parameters between HD and PD patients, 2022 patients, 2022 HD PD P-Value n= 46153 n= 5740 Mean 57.4 38.1 25.9 4.2 737.3 10.26 SD 13.5 4.7 5.8 1.0 163.8 1.69 Mean 51.0 31.8 25.4 4.8 720.1 10.28 SD 16.2 6.4 8.8 1.3 184.6 1.71 <0.0001a <0.0001a <0.0001a <0.0001a <0.0001a 0.0368a Age Albumin (g/dL) BMI Total Cholesterol (mmol/L) Sr Creatinine ( mol/L) Haemoglobin a Independent t-test
Table 4.3.2(a): Nutritional parameters between diabetic and Table 4.3.2(a): Nutritional parameters between diabetic and non non- -diabetic HD patients, 2022 diabetic HD patients, 2022 Diabetes n= 25124 Non-Diabetes n= 25285 Mean 60.68 37.72 26.75 4.11 714.19 10.24 P-Value Mean 54.11 38.53 25.06 4.27 763.04 10.27 SD SD <0.0001a <0.0001a <0.0001a <0.0001a <0.0001a 0.0586 a Age Albumin (g/dL) BMI Total Cholesterol (mmol/L) Sr Creatinine ( mol/L) Haemoglobin 14.82 4.60 5.70 1.01 161.10 1.73 11.20 4.74 5.70 1.06 162.79 1.65 a Independent t-test
Table 4.3.2(b): Nutritional parameters between diabetic and Table 4.3.2(b): Nutritional parameters between diabetic and non non- -diabetic PD patients, 2022 diabetic PD patients, 2022 Diabetes n=3425 Non-Diabetes n=4154 Mean 58.24 30.66 26.93 4.60 690.70 10.39 P-Value Mean 44.96 32.67 24.16 4.88 750.14 10.23 SD SD <0.0001a <0.0001a <0.0001a <0.0001a <0.0001a <0.0001a Age Albumin (g/dL) BMI Total Cholesterol (mmol/L) Sr Creatinine ( mol/L) Haemoglobin 17.10 6.23 6.73 1.27 178.91 1.77 11.41 6.49 10.66 1.29 185.34 1.63 a Independent t-test
Table 4.3.3(a): Distribution of serum albumin and BMI by Table 4.3.3(a): Distribution of serum albumin and BMI by duration of dialysis among HD patients, 2012 duration of dialysis among HD patients, 2012- -2022 2022 Years <1 1-<5 5-<10 >=10 P-Value Mean 35.60 25.72 SD 5.51 6.12 Mean 38.12 26.40 SD 3.86 5.89 Mean 39.13 26.04 SD 3.13 5.53 Mean 39.73 24.62 SD 2.89 4.59 0.0001c 0.0001c Albumin (g/dL) BMI c ANOVA
Table 4.3.3(b): Distribution of serum albumin and BMI by Table 4.3.3(b): Distribution of serum albumin and BMI by duration of dialysis among PD patients, 2012 duration of dialysis among PD patients, 2012- -2022 2022 Years <1 1-<5 5-<10 >=10 P-Value Mean 31.94 26.04 SD 6.93 14.78 Mean 32.78 25.45 SD 5.44 5.73 Mean 33.89 24.46 SD 4.35 5.00 Mean 34.22 22.32 SD 4.14 4.78 0.0001c 0.0001c Albumin (g/dL) BMI c ANOVA


: Nutritional parameters between diabetic and")
: Nutritional parameters between diabetic and")
: Distribution of serum albumin and BMI by")
: Distribution of serum albumin and BMI by")