Explore the detailed analysis of public sector compensation in Oakland, including comparisons to median values and take-home pay in San Francisco. The data covers various job positions and provides insights into the market competitiveness of salaries and benefits.
Please find below an Image/Link to download the presentation.
The content on the website is provided AS IS for your information and personal use only. It may not be sold, licensed, or shared on other websites without obtaining consent from the author. If you encounter any issues during the download, it is possible that the publisher has removed the file from their server.
You are allowed to download the files provided on this website for personal or commercial use, subject to the condition that they are used lawfully. All files are the property of their respective owners.
The content on the website is provided AS IS for your information and personal use only. It may not be sold, licensed, or shared on other websites without obtaining consent from the author.
E N D
Presentation Transcript
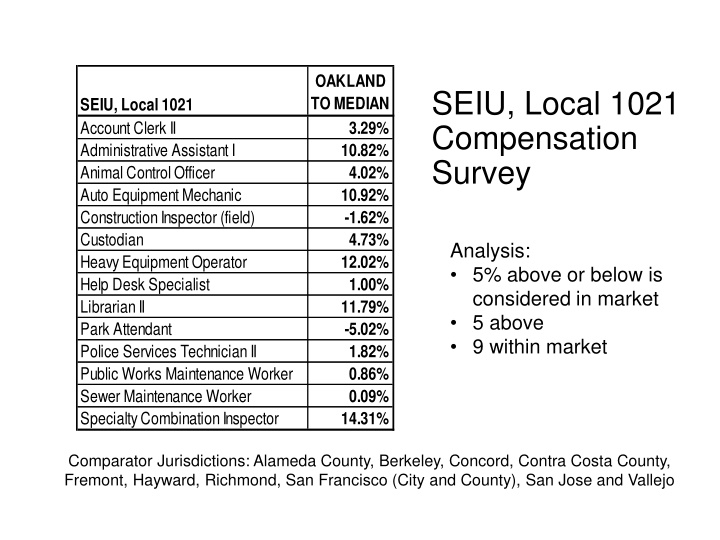
OAKLAND TO MEDIAN 3.29% 10.82% 4.02% 10.92% -1.62% 4.73% 12.02% 1.00% 11.79% -5.02% 1.82% 0.86% 0.09% 14.31% SEIU, Local 1021 Compensation Survey SEIU, Local 1021 Account Clerk II Administrative Assistant I Animal Control Officer Auto Equipment Mechanic Construction Inspector (field) Custodian Heavy Equipment Operator Help Desk Specialist Librarian II Park Attendant Police Services Technician II Public Works Maintenance Worker Sewer Maintenance Worker Specialty Combination Inspector Analysis: 5% above or below is considered in market 5 above 9 within market Comparator Jurisdictions: Alameda County, Berkeley, Concord, Contra Costa County, Fremont, Hayward, Richmond, San Francisco (City and County), San Jose and Vallejo
OAKLAND TO MEDIAN IFPTE, Local 21 Compensation Survey IFPTE, Local 21 Account Clerk III Accountant III Administrative Analyst II Administrative Assistant II Deputy City Attorney II Deputy City Attorney III Engineer, Assistant I Civil Engineer Equipment Supervisor Human Resources Analyst Information Systems Specialist II Librarian, Supervising Management Assistant Planner II Public Works Supervisor I Real Estate Agent Recreation Supervisor Urban Economic Analyst II Comparator Jurisdictions: Alameda County, Berkeley, Concord, Contra Costa County, Fremont, Hayward, Richmond, San Francisco (City and County), San Jose and Vallejo 1.65% 2.59% -7.63% 6.87% 2.75% -0.68% 4.89% 5.56% 9.49% -5.81% 10.98% 13.55% -0.58% -4.53% 7.12% 6.74% 14.97% -4.21% Notes: 5% above or below is considered in market 8 classes above 8 within market 2 classes below
Oakland Net Take Home Pay Comparison vs San Francisco San Francisco City/County San Francisco City/County Oakland Oakland Engineer, Civil (Office) Associate Engineer Account Clerk II** Classification Classification Account Clerk Base Salary (6/30/19)* 121,276 131,450 Base Salary (6/30/19)* 59,873 65,227 Less: Employee Benefit Contributions Less: Employee Benefit Contributions Active Employee Healthcare (Family Coverage) - (3,515) Active Employee Healthcare (Family Coverage) - (3,515) Active Employee Pension (Classic Tier) (9,702) (15,117) Active Employee Pension (Classic Tier) (4,790) (7,175) Active Employee OPEB Contribution - (2,629) Active Employee OPEB Contribution - (1,305) Sub-total Employee Benefit Contributions (9,702) (21,260) Sub-total Employee Benefit Contributions (4,790) (11,994) Net Take Home Pay 111,574 110,190 Net Take Home Pay 55,083 53,233 * Does not include other cash compensation such as premiums, allowances, or overtime. ** Adjusted to 40 hour work week.
Oakland Net Take Home Pay Comparison vs San Francisco San Francisco City/County San Francisco City/County Oakland Oakland Real Estate Agent Real Property Officer Auto Equipment Mechanic Automotive Mechanic Classification Classification Base Salary (6/30/19)* 107,536 118,212 Base Salary (6/30/19)* 83,213 91,227 Less: Employee Benefit Contributions Less: Employee Benefit Contributions Active Employee Healthcare (Family Coverage) - (3,515) Active Employee Healthcare (Family Coverage) - (3,515) Active Employee Pension (Classic Tier) (8,603) (13,594) Active Employee Pension (Classic Tier) (6,657) (10,035) Active Employee OPEB Contribution - (2,364) Active Employee OPEB Contribution - (1,825) Sub-total Employee Benefit Contributions (8,603) (19,473) Sub-total Employee Benefit Contributions (6,657) (15,374) Net Take Home Pay 98,933 98,738 Net Take Home Pay 76,556 75,853 * Does not include other cash compensation such as premiums, allowances, or overtime.