Observational Techniques and Tools: Observing Principles and Methods
Explore observational techniques and practical tools for astrophysical observations in the Fall 2023 course. Discover topics like exposure time calculation, coordinate systems, time systems, observability, airmass, and useful observability tools from John Thorstensen of Dartmouth. Enhance your understanding of observation planning, summing, and averaging measurements, as well as telescope use and planning in this informative content.

Download Presentation

Please find below an Image/Link to download the presentation.
The content on the website is provided AS IS for your information and personal use only. It may not be sold, licensed, or shared on other websites without obtaining consent from the author. If you encounter any issues during the download, it is possible that the publisher has removed the file from their server.
You are allowed to download the files provided on this website for personal or commercial use, subject to the condition that they are used lawfully. All files are the property of their respective owners.
The content on the website is provided AS IS for your information and personal use only. It may not be sold, licensed, or shared on other websites without obtaining consent from the author.
E N D
Presentation Transcript
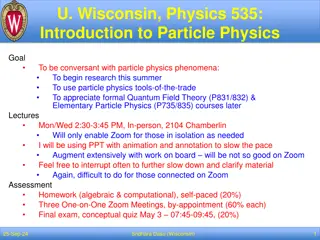
ASTR 535 Observational Techniques Fall 2023 Observing principles and tools
Topics 9/12 Questions Exposure time calculator New module : observing concepts and tools APO observing trip schedule : Fri-Sun 10/20B, 10/21B, 10/22A 4thquarter NMSU programs Time systems Coordinate systems Observability
Coordinate systems and time Time Solar and sidereal time Coordinates right ascension / declination hour angle / declination az / alt airmass
What time is it? Local legal time? Universal time (UT)? Sidereal time? If you were observing right now, what would be the optimal right ascension?
Observability What do you need to know to determine if/when an object will be observable? How long will it be observable? HA = LST RA How high will it get? at HA=0, zenith distance = |Dec latitude} Airmass : how is airmass related to zenith distance? X ~ sec(Z)
Observability tools From John Thorstensen, Dartmouth: skycalendar / skycalc : C programs, text output JSkyCalc : Java, graphical output Installation and demo : seasonal observability, nightly almanac, hourly circumstances, airmass graphs, object lists astroplan : astropy-affiliated package Various tools, graphical output Note: interface implemented in pyvista Airmass.org
Observability See Canvas assignment
Topics 9/14 Questions Summing and averaging measurements Observation planning TMO observing : Mon/Tues/Wed evenings next week? Exposure time calculator Telescope use and planning Digital images and image display
Summing and averaging Weighted averaging of different measurements Expected scatter vs observed scatter
Observation planning Sidereal time and right ascension (mean) Sun is always on the meridian at noon (modulo daylight savings) Sidereal clock runs just a tiny bit faster than solar clock, so in a given day, one hour of solar time is almost the same as one hour of sidereal time On vernal equinox, Sun is at RA=0hr, by definition. So 0hr crosses meridian at noon, hence 1h crosses at 13:00, 2h at 14:00, . 12h at midnight The 4 minutes per day difference between sidereal and solar adds up: after 15 days it amounts to 1 hour, after 30 days, 2 hrs, etc. So each month after the vernal equinox, the RA of the Sun increases by 2 hours: so on April 21, Sun is at RA=2h (and 14h crosses meridian at midnight),on May 21, Sun is at RA=4h (and 16h crosses meridian at midnight), etc. etc .
Image display See Canvas assignment
9/18 (Monday night) TMO demo/training
9/21 Questions Next week TMO observing Working with digital images File formats Calculating expected noise Basic data reduction TMO data inspection
TMO observing planning The initial TMO observing project will be: Determine the instrumental zeropoints for TMO for the 5 Sloan filters (SU, SG, SR, SI, SZ) Estimate the combined throughput of telescope, optics, and detector for each filter
TMO project observing resources For photometric zeropoints, want stars with known magnitudes If we wanted to get more subtle, would include stars with a range of colors to see if there are color-dependent zeropoints, i.e. transformation terms Traditionally, e.g., UBVRI used fields with relatively bright (V~-10-12) standard stars, e.g. Landolt fields http://articles.adsabs.harvard.edu//full/1992AJ....104..340L/0000340.000.html Note Selected Areas For SDSS, the actual photometric system is defined by the SDSS observations themselves These are saturated for bright stars! A u g r i z system was set up which is close, but not identical to SDSS. These used the same Landolt fields, Smith et al 2002, see table 7. It will suffice for our use! For finding charts, see Landolt paper Smaller fields: http://james.as.arizona.edu/~psmith/61inch/ATLAS/tableA.html Choose fields based on LST at observation time What do you expect for exposure times? For throughput, want spectrophotometric standard, e.g. from http://www.eso.org/sci/observing/tools/standards/spectra.html
TMO observing See astronomy.nmsu.edu/tmo-wiki, esp TMO Users guide HowTo Get a VNC client to connect to desktop Alternatively/additionally, go to http://tmo.nmsu.edu for web based control
TMO observing resources General observing procedure: Connect to TMO desktop by VNC to tmo.nmsu.edu or to web interface (tmo.nmsu.edu) Open dome Focus Slew to star(s) Take exposures Take calibration frames: darks (match exposure times) and twilight flats Data will be automatically synced to astronomy.nmsu.edu In the morning, link in /home/tmo/YYYYMMDD (also accessible via web http://astronomy.nmsu.edu/tmo/YYYYMMDD (note day number is UT date) More quickly, in /home/tmo/Observations/YYYY-MM-DD if taken directly with MaximDL (but note day number is local date)
TMO analysis Looking at images Image analysis Image size measurements Basic photometry
pyvista Demo imred module Reducer object log() rd() tv module TV object tv() imexam() Stars mark() photom()
pyvista Documentation Installation Create conda environment pip install astro-pyvista Running ipython pylab Jupyter notebook : %matplotlib qt
Topics 9/26 TMO status and observing Exposure time calculator Next module: effects of the Earth s atmosphere Midterm : week of October 10 Looking at TMO data Basic image reading, e..g., pyvista imred.Reducer(), rd() and reduce() methods Basic image display, e.g.,, pyvista TV tool, tv() method Measuring image sizes, e.g. imexam() method of TV tool Basic stellar photometry, e.g. stars.mark(), stars.photom() Determining gain from flats Determining readout noise from biases
Image inspection While you may be using pyvista, important to recognize the (relatively simple!) things that are being done Instantiating a Reducer : sets up parameters for a detector reduce() : without other arguments, calculates mean overscan level and subtracts it from image. Calculates expected uncertainty in array TV.imexam() : fits a 2D gaussian to points around cursor Stars.photom() : simple aperture photometry
Measuring gain and readout noise Basic idea: uncertainty (noise) in counts depends on the gain, so measure the noise and determine gain, under the assumption of Poisson statistics (so measure at high level, where readout noise is negligible) How to measure noise: use flat field, but can t just look at variation in a region, because there might be real sensitivity variations Take the difference between two flats Calculate standard deviation in region of ~constant intensity G = 2 <C> / ?^2 For readout noise, look at bias frames (C=0) and measure noise in counts in a similar way, convert to noise in electrons using gain
Exercises See Image Inspection II in Canvas
Topic 9/28 TMO Status Questions Effects of the Earth s atmosphere Atmospheric (and other background ) emission Sky model calculator Exposure time calculator Image inspection II Light transfer curve
Canvas : sky emission and exposure time calculator Canvas : image inspection II
10/17 Midterm TMO APO trip planning Logistics: transportation, housing, food Introduction to 3.5m Science programs Observation planning Science programs : 1-2 per group Concisely summarize the science summarize time and conditions (dark/bright) needed Summarize location of targets in the sky (first half/second half with more details as needed) Proposed observing plans: 10/20B, 10/21B, 10/22A
10/19 APO trip planning Logistics: transportation, housing, food Telescope / instrument / exposure control Instrument calibrations Observation planning
TUI and telescope/instrument control in general Status : where is telescope, what is time, airmass etc Telescope control Slewing Offsetting Focus Instrument configuration Imagers: filter Spectrograph: grating, grating tilt Detector: binning, subregion etc Taking exposures File names and locations Exposure times Start/stop/abort Acquisition (esp for spectrographs) Slit viewer Moving object to slit Guiding : on slit and offset Instrument and TUI manuals : https://www.apo.nmsu.edu/arc35m/
Instrument calibrations Instrument manauls ARCTIC Flats: dome and twilight Biases: (may not be needed, but never hurts to take!) Darks? ARCES Internal flats Internal wavelength cals : may need to take periodically due to shifts Biases (may not be needed, but never hurts to take) KOSMOS External flats and wavelength cals Internal flats and wavelength cals Biases (as above) Flux calibration / standard stars


")


![[PDF⚡READ❤ONLINE] Solar Surveyors: Observing the Sun from Space (Springer Praxis](/thumb/21536/pdf-read-online-solar-surveyors-observing-the-sun-from-space-springer-praxis.jpg)