Observations of BrO and HOBr by GT-CIMS during CONTRAST 2014
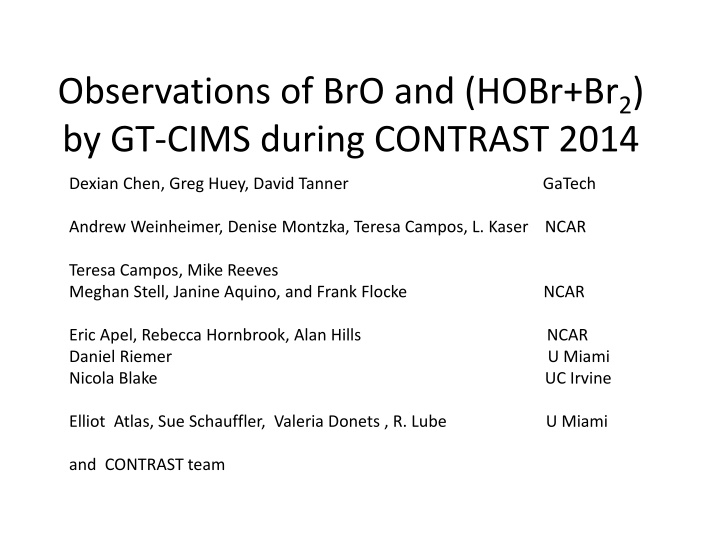
This study conducted by Dexian Chen, Greg Huey, David Tanner at Georgia Tech and Andrew Weinheimer, Denise Montzka, Teresa Campos, L aims to analyze the presence of bromine compounds in the atmosphere over a specific period during the CONTRAST 2014 campaign. The data collected using GT-CIMS provides insights into the distribution and behavior of BrO and (HOBr + Br2), shedding light on atmospheric chemistry dynamics and potential impacts on air quality and climate.

Uploaded on Feb 22, 2025 | 1 Views
Download Presentation

Please find below an Image/Link to download the presentation.
The content on the website is provided AS IS for your information and personal use only. It may not be sold, licensed, or shared on other websites without obtaining consent from the author.If you encounter any issues during the download, it is possible that the publisher has removed the file from their server.
You are allowed to download the files provided on this website for personal or commercial use, subject to the condition that they are used lawfully. All files are the property of their respective owners.
The content on the website is provided AS IS for your information and personal use only. It may not be sold, licensed, or shared on other websites without obtaining consent from the author.
E N D
Presentation Transcript
Observations of BrO and (HOBr+Br2) by GT-CIMS during CONTRAST 2014 Dexian Chen, Greg Huey, David Tanner GaTech Andrew Weinheimer, Denise Montzka, Teresa Campos, L. Kaser NCAR Teresa Campos, Mike Reeves Meghan Stell, Janine Aquino, and Frank Flocke NCAR Eric Apel, Rebecca Hornbrook, Alan Hills NCAR Daniel Riemer U Miami Nicola Blake UC Irvine Elliot Atlas, Sue Schauffler, Valeria Donets , R. Lube U Miami and CONTRAST team
CIMS Chemical Ionization Mass Spectrometer Flow Tube (reactor) Mass Spec. inlet Measurements: BrO+I- BrO I- (m/z=222, 224) HOBr+I- HOBr I- (m/z=223, 225) Br2+I- Br2 I- (m/z=285, 287, 289) (HOBr Br2 , report the sum of HOBr+Br2)
CIMS Chemical Ionization Mass Spectrometer Cal Gas Flow Tube (reactor) Mass Spec. inlet Calibrations: Online: periodically flowed cal gas (Br2, Cl2) into the CIMS Offline: compared sensitivities of BrO, HOBr to sensitivities of the cal gas (in the lab)
Measurement Issues During the field campaign we became concerned that Br2 calibration gas could contaminate inlet walls. i.e. Br2 BrO Problem alleviated by switching to Cl2 calibration gas at RF09. For now only reporting data for RF09-RF16 Very high O3 levels may also lead to BrO artifact during RF15. Needs work but more importantly comparison to DOAS data.
Most of the time Levels of BrO and HOBr+Br2 near the limits of detection (LOD) LOD for BrO, 0.3-1.5 ppt LOD of HOBr+Br2, 0.5-2 ppt e.g., RF12 (2/16-2/17) 0.6 14x103 12 0.4 10 0.2 8 BrO/ppt ALT/m 0.0 6 -0.2 4 BrO/ppt ALT/m 2 -0.4 01:00 2014/2/17 02:00 03:00 dat
GUAM RF10(2/8) Flight Goal Sample a large pollution plume 16 14 12 14x103 12 10 LAT 10 8 ALT/m 8 6 6 4 4 2 2 0 1.0 142 144 146 148 150 152 LON 14x10 14x103 3 6 BrO/ppt HOBr+Br2/ppt ALT 12 12 0.8 BrO or (HOBr+Br2)/ppt 10 10 4 0.6 ALT/m ALT/m 8 8 2 0.4 6 6 4 4 0 0.2 2 2 -2 0.0 00:30 2014/2/8 01:00 01:30 02:00 dat
RF10 (2/8) 1.0 200 14x10 14x103 3 0.8 12 12 1.0 150 14x10 14x103 3 140 10 10 NO or NO2 /ppt 0.6 12 12 120 0.8 ALT/m ALT/m 8 8 CO or O3 /ppb 100 10 10 100 0.6 0.4 6 6 ALT/m ALT/m CO/ppb O3/ppb ALT/m 80 8 8 4 4 60 0.4 6 6 0.2 NO/ppt NO2/ppt ALT/m 50 40 4 4 2 2 0.2 20 2 2 0.0 0 0.0 0 0 00:30 2014/2/8 01:00 01:30 02:00 00:00 2014/2/8 00:30 01:00 01:30 02:00 dat dat 1.0 14x10 14x103 3 160 CH3CN/ppt ALT/m 1.0 14x10 14x103 3 0.8 12 12 140 10 10 120 12 12 0.8 CH3CN/ppt 600 0.6 Acetone/ppt HCN/ppt ALT/m ALT/m ALT/m 8 8 ACETONE or HCN/ppt 100 10 10 0.6 0.4 6 6 80 ALT/m ALT/m 8 8 400 4 4 0.2 60 0.4 6 6 2 2 40 4 4 0.0 0 0 200 0.2 00:00 2014/2/8 00:30 01:00 01:30 2 2 0 0.0 dat 00:00 2014/2/8 00:30 01:00 01:30 02:00 dat
GUAM 14x103 13 RF11 (02/12-0213) 12 12 10 ALT/m 8 11 Flight Goal Sample the O3 layer south of Guam Sample convective outflow 6 LAT 10 4 2 9 0 8 7 130 132 134 136 138 LON 140 142 144 146 1.0 14x10 14x103 3 6 12 12 0.8 BrO or HOBr+Br2 /ppt 10 10 4 BrO/ppt HOBr/ppt ALT/m 0.6 ALT/m ALT/m 8 8 2 0.4 6 6 4 4 0.2 0 2 2 0.0 00:00 2014/2/13 00:30 01:00 01:30 02:00 dat
RF11 (02/12-0213) 1.0 14x10 14x103 3 120 12 12 0.8 100 10 10 O3 or CO/ppb 0.6 80 ALT/m ALT/m 8 8 CO/ppb O3/ppb ALT/m 0.4 6 6 60 4 4 40 0.2 200 200 1.0 2 2 14x10 14x103 3 20 0.0 12 12 0.8 150 150 00:00 2014/2/13 00:30 01:00 01:30 10 10 O(v)/ppm H H2 2O(v)/ppm 0.6 dat H2O(v)/ppm ALT/m ALT/m ALT/m 1.0 8 8 14x10 14x103 3 100 100 Acetone/ppt HCN/ppt ALT/m 0.4 6 6 500 12 12 0.8 4 4 ACETONE or HCN/ppt 50 50 0.2 10 10 400 2 2 0.6 ALT/m ALT/m 8 8 0.0 0 0 300 00:00 2014/2/13 01:00 02:00 03:00 0.4 6 6 dat 4 4 200 0.2 2 2 100 0.0 00:00 2014/2/13 01:00 02:00 dat
40 14x103 RF15 (2/24-2/25) 12 35 10 30 8 ALT/m 6 Flight Goal Transect to Japan LAT 25 4 2 20 0 15 Spike in BrO w/o increase in HOBr? 10 144 145 146 147 148 149 150 LON 1.0 14x10 14x103 3 12 12 15 0.8 GUAM BrO or (HOBr+Br2)/ppt 10 10 BrO/ppt HOBr+Br2/ppt ALT/m 0.6 ALT/m ALT/m 10 8 8 6 6 0.4 5 4 4 0.2 2 2 0 0.0 0 0 00:00 2014/2/25 03:00 06:00 dat
RF15(02/24) 1.0 5.0 5.0 14x10 14x103 3 800 12 12 0.8 4.5 4.5 10 10 600 H H2 2O(v)/ppm 0.6 4.0 4.0 ALT/m ALT/m 8 8 O3/ppb O(v)/ppm 400 6 6 0.4 3.5 3.5 4 4 O3/ppb H2O(v)/ppm ALT 200 0.2 3.0 3.0 2 2 0.0 00:00 2014/2/25 03:00 06:00 1.0 240 14x10 14x103 3 dat 12 12 0.8 230 10 10 CFC_11/ppt 220 0.6 ALT/m ALT/m 8 8 210 6 6 0.4 4 4 200 CFC_11 (CCl3F)/ppt ALT Br_key 0.2 2 2 190 0.0 00:00 2014/2/25 03:00 06:00 dat
Summary Most of the time no significant levels of BrO and (HOBr+Br2) were observed There were a limited number of enhanced layers of BrO and HOBr. They correspond to either stratospheric air or tropospheric air impacted by biomass/pollution.
Ongoing work Comparisons needed with DOAS to confirm elevated BrO levels and to investigate possible high ozone issue. RF15, RF11, RF10, and transit are high priorities. Compare stratospheric BrO/HOBr to model calculations. Investigate origins of high tropospheric signals
Transit (2/28-3/1) 40 35 12x103 GOAL OF FLIGHT Transit(Honolulu- Boulder) 10 30 8 ALT/m 6 4 25 2 0 20 1.0 -150 -140 -130 -120 -110 12x103 25 0.8 10 20 BrO or (HOBr+Br2)/ppt 0.6 8 15 ALT/m 6 BrO/ppt HOBr+Br2/ppt ALT/m 0.4 10 4 0.2 5 2 0 0.0 02:00 2014/3/1 03:00 04:00 05:00 dat
Transit flight(02/28-03/01) 1.0 5.0 3 12x10 800 0.8 4.5 10 600 H2O(v)/ppm 8 0.6 4.0 ALT/m O3/ppb 6 400 0.4 3.5 O3/ppb H2O(v)/ppm ALT 4 0.2 200 3.0 2 0.0 0 02:00 2014/3/1 03:00 04:00 05:00 dat O3: Weinheimer et al Water vapor: GV platform
CIMS Chemical Ionization Mass Spectrometry Flow Tube (reactor) Mass Spect inlet Charcoal filter backgrounding Three way valve (periodical measurements mode and background mode)
Offline calibrations in the Lab (BrO) CIMS Br2 Br2+O3 CIMS 350 C Br2+O3 2BrO (Liao et al., 2011)
Offline calibrations in the Lab(HOBr) N2 HOBr(g) CIMS NaBr salt bed HOBr soln. HOBr+NaBr(het) (Liao et al., 2011) Br2
")


")

")

")


")
")

")
")
")