Observing Visual Stories: Data Lens, Arctic Ice, and Climate Art
Explore the impact of climate change through visual storytelling, maps, and artworks like Diane Burko's Glacier Quadtych. Delve into glacier loss, Arctic sea ice extents, and the intersection of art and climate science.

Download Presentation

Please find below an Image/Link to download the presentation.
The content on the website is provided AS IS for your information and personal use only. It may not be sold, licensed, or shared on other websites without obtaining consent from the author.If you encounter any issues during the download, it is possible that the publisher has removed the file from their server.
You are allowed to download the files provided on this website for personal or commercial use, subject to the condition that they are used lawfully. All files are the property of their respective owners.
The content on the website is provided AS IS for your information and personal use only. It may not be sold, licensed, or shared on other websites without obtaining consent from the author.
E N D
Presentation Transcript
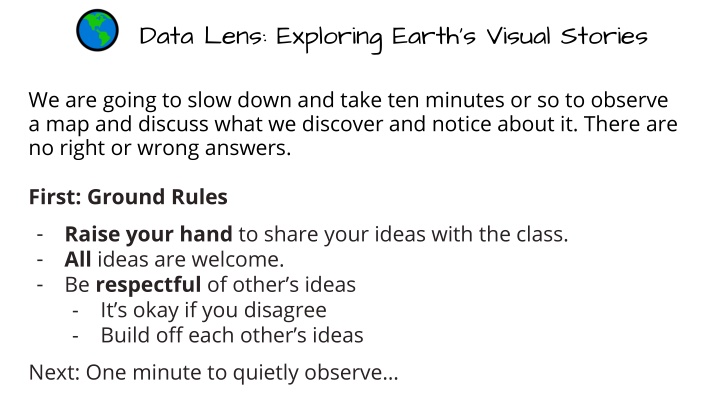
Data Lens: Exploring Earths Visual Stories We are going to slow down and take ten minutes or so to observe a map and discuss what we discover and notice about it. There are no right or wrong answers. First: Ground Rules - Raise your hand to share your ideas with the class. - All ideas are welcome. - Be respectful of other s ideas - It s okay if you disagree - Build off each other s ideas Next: One minute to quietly observe
Whats going on here? Diane Burko; Grinnell Mt. Gould Quadtych National Climate Assessment 5; Art x Climate
Answer on your worksheet: Grinnell Mt. Gould Quadtych Glacier What do these two images have in common? In what ways do these images differ? What do you think the timelapse of the glacier is trying to convey? What do you think the snapshot of Arctic Sea Ice minimum is trying to convey? 1) 2) 3) 2024 Arctic sea ice minimum 4)
End of Data Lens Learn more about the dataset and the artwork. Read the descriptions on the next two slides. (5 min) Then, read an article and summarize it in 30 words. (20 min)
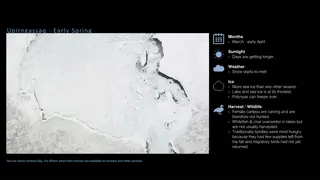
2024 Arctic sea ice summer minimum Sea ice concentration in the Arctic Ocean on September 11, 2024, the day of the smallest minimum ice extent of the year. The gold line shows the median extent of ice from 1981-2020, meaning half of the years had larger extents on this day, and half had smaller. The ice extent the area of ocean at least 15% covered by ice in 2024 was seventh smallest on record. NOAA Climate.gov image, based on data from the National Snow and Ice Data Center. Source: National Snow and Ice Data Center
Diane Burko Grinnell Mt. Gould Quadtych (2009, oil on canvas) Artist's statement: This work portrays Grinnell Glacier in Glacier National Park, Montana in four time periods between 1920 and 2006, with the glacier losing mass in each painting. The piece considers the marks that humanity leaves on the landscape, reflecting the impact of industrial and colonial activity on those same landscapes. While these paintings deal with impending climate catastrophe, rather than lingering in dystopia they celebrate the sublimity of the landscape by honoring the intricate geological and political webs that shape the identity of a place. Source: Fifth National Climate Assessment Art x Climate Gallery
Reading Extension High School level (10-20 minutes) Reading Extension: What s the coldest the Earth s ever been? Summarize the article in ~30 words. Present your summary to the class.


 What’s going on in this image?")