Occupational Bladder Cancer Epidemiology: Insights from British Workers
Explore the epidemiology of occupational bladder cancer in British workers through cohort studies and meta-analyses. Discover trends in bladder cancer diagnosis, mortality rates, and regional variations over decades. Gain insights into occupational risks and implications for public health.

Download Presentation

Please find below an Image/Link to download the presentation.
The content on the website is provided AS IS for your information and personal use only. It may not be sold, licensed, or shared on other websites without obtaining consent from the author. If you encounter any issues during the download, it is possible that the publisher has removed the file from their server.
You are allowed to download the files provided on this website for personal or commercial use, subject to the condition that they are used lawfully. All files are the property of their respective owners.
The content on the website is provided AS IS for your information and personal use only. It may not be sold, licensed, or shared on other websites without obtaining consent from the author.
E N D
Presentation Transcript
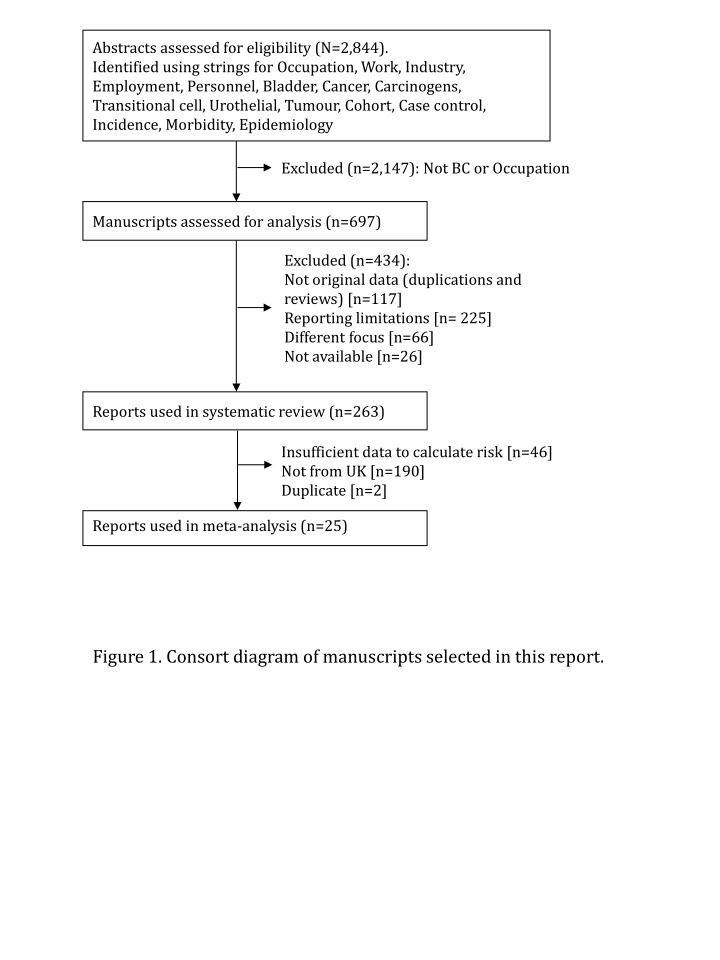
Abstracts assessed for eligibility (N=2,844). Identified using strings for Occupation, Work, Industry, Employment, Personnel, Bladder, Cancer, Carcinogens, Transitional cell, Urothelial, Tumour, Cohort, Case control, Incidence, Morbidity, Epidemiology Excluded (n=2,147): Not BC or Occupation Manuscripts assessed for analysis (n=697) Excluded (n=434): Not original data (duplications and reviews) [n=117] Reporting limitations [n= 225] Different focus [n=66] Not available [n=26] Reports used in systematic review (n=263) Insufficient data to calculate risk [n=46] Not from UK [n=190] Duplicate [n=2] Reports used in meta-analysis (n=25) Figure 1. Consort diagram of manuscripts selected in this report.
0.4 1.0 24.0 Figure 2. A Forest plot of the pooled relative risks of new bladder cancer diagnosis (incidence) in British workers 1930 to 2010.
0.23 1.0 4.3 Figure 3. A Forest plot of the pooled relative risks of bladder cancer disease specific mortality (DSM) in British workers 1930 to 2010.
(a). Mortality in males (b). Mortality in females Figure 4. Regional trends in standardized mortality from bladder cancer from 1974 to 2014 in (a). Males and (b). Females. Rates are presented relative to those in South East (lowest). Data were collated in standard regions from 1974 to 1980, then in GOR from 1981-2014
13 12 11 Pooled RR 10 9 RR (95%CIs) 8 7 6 5 4 3 2 1 0 1950s 1960s 1970s 1980s 1990s Figure 5. Trend in overall risk of occupational bladder cancer over the decades between 1950 and 1990. Graph shows the pooler RR for all occupations by decade with error bars representing the 95% confidence intervals.
.")


. Mortality in males")