Ocean Observatories Initiative Data Tasks May 2015 Update
The update covers the completion timeline of core EPE software, integration tasks, remaining funds allocation, science program management responsibilities, user support and outreach role, and help desk procedures for external users. It outlines the construction schedule, software completion expectations, visualization tool development, data oversight, subcontractor management, and technical support provided to end users. Key individuals involved include Sage Lichtenwalner, John Kerfoot, Mike Kelly, Mike Vardaro, and Ivan Rodero.

Download Presentation

Please find below an Image/Link to download the presentation.
The content on the website is provided AS IS for your information and personal use only. It may not be sold, licensed, or shared on other websites without obtaining consent from the author.If you encounter any issues during the download, it is possible that the publisher has removed the file from their server.
You are allowed to download the files provided on this website for personal or commercial use, subject to the condition that they are used lawfully. All files are the property of their respective owners.
The content on the website is provided AS IS for your information and personal use only. It may not be sold, licensed, or shared on other websites without obtaining consent from the author.
E N D
Presentation Transcript
Ocean Observatories Initiative OOI-CI Data Team Tasks 07 May 2015 May 2015
EPE Construction through August 31 Core EPE software and integration will be complete on June 30 (Data Investigation Builder, Concept Mapping, Vocab Navigator, Custom Visualization tools) EPE expects to host a conditional acceptance of software in late June EPE will need Raytheon Omaha and ASA to complete web services and asset management construction before several EPE visualization tools can be completed and integrated with uFrame. Visualization tools that will be completed include single time series, single time series with map, double time series, glider profiler explorer, glider profiler comparer and the profiler explorer/comparer Remaining funds of $XX,XXX will be used by Sage Lichtenwalner and John Kerfoot to complete the EV tool construction/integration (X hours), and for the University of Maine to test and document the tools (X hours). 1 May 2015
Science Program Manager Coordinating management of the entire OOI CI project with the System Engineering PM Managing the Data Management team and the User Support and Outreach position Ensure continuous quality data delivery from the entire OOI Strategic planning, scheduling and budgetary responsibility Working with the Marine IOs, Science Advisory Teams and COL on data oversight Managing subcontractors (e.g. ASA) Authoring quarterly reports 2 May 2015
User Support and Outreach Serve as the primary point of contact for software inquiries and general OOI questions from end users including researchers, scientists, marine operators, educators and students Provide technical support on the software and user interface Coordinate with the Data Manager to identify and resolve user issues Work with software developers to resolve user issues with the system and user interface Develop training and outreach materials Oversee the organization of four technical training and outreach programs per year to support observatory users, early career scientists, students and educators 3 May 2015
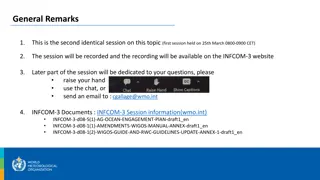
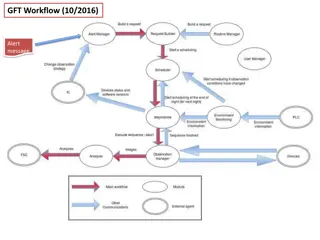
Help Desk Process External Users Questions Policy & Proposals Mike Kelly Data Mike Vardaro Help Desk Sage Lichtenwalner Instrument Additions Mike Kelly Software Assistance Sage Lichtenwalner Marine HW Science PM & Marine IOs General OOI Information Sage Lichtenwalner System & IT Ivan Rodero help@oceanobservatories.org (planned) Redmine used to track trouble tickets. Help desk is responsible for triaging initial inquiries and ticket closing. Help desk will be covered by DM and PM in Help Desk absence. 4 May 2015
OOI FAQs The existing OOI FAQ page will be significantly updated this month and include the following four categories: Background: Questions on the general OOI, components, science themes, partnerships, funding and management OOI Related Proposals: General discussion on the NSF plan for acceptance of proposals and future announcement. Access to OOI Data: Questions on who has access, data policy, ownership, new sensors, publishing OOI Data Content and QC: Questions regarding responsibilities, sampling strategies, calibration, shipboard data, QA/QC process and algorithms 5 May 2015
Data Manager Tasks Manages (and assist in hiring of) team of four data evaluators, directing data evaluation efforts Provides technical expertise for evaluations of data and OOI GUI capabilities Works with domain scientists and Marine IOs to translate requirements into QA/QC, validation, and sampling strategy best practices Work with the CI systems and software team on the design, operation, and optimization of the data management infrastructure Responsible for managing the data life cycle and archiving methods Communicate OOI data management strategies to community and collect feedback for incorporation into OOI processes and procedures 6 May 2015
Data Evaluator Tasks Evaluate OOI data daily and report evaluations weekly Develop appropriate scripts and plotting tools to analyze streaming & telemetered data Maintain database of evaluated data Outward facing towards Global, Regional, Endurance, and Pioneer Arrays Remain up to date on data processing tools, computer languages, and instrumentation changes Assist with writing of technical reports and preparation of conference presentations 7 May 2015
Rutgers Data Evaluation Team Science Leadership Team: Scott Glenn Physics, Model-Observation Fusion, Fluid Dynamics Oscar Schofield Biology, Optics, Genetics, Ecology Program Manager: Mike Crowley (M.S. 1993) Physics, coastal oceanography, remote sensing, Gulf Stream Data Manager: Mike Vardaro (M.S. 2004, Ph.D. 2008) Marine Biologist, OOI Project Scientist, expertise in benthic biogeochemistry, photography, carbon flux Assistant Data Manager: Leila Belabbassi (M.S. 2001, Ph.D. 2006) Physical expertise, experience in water column dynamics, acoustics, oxygen/hypoxia Data Evaluators: Lori Garzio (M.S., 2012) Biological expertise, focus on plankton biology, high-latitude dynamics, bioacoustics Friedrich Knuth (M.S., 2014) June 8 start date Geology expertise, focus on geomorphology, geochemistry, data visualization, acoustic surveying Mike Smith (B.S. 2009) Physical expertise, focus on atmospheric and coastal physics and circulation, some biology 8 May 2015
Responsibility Matrix Data Evaluation Team Responsibilities OOI Science Drivers Topics M. Vardaro L. Belabbassi L. Garzio F. Knuth M. Smith Nutrient Transport Biological Transport POC/DOC Transport Dissolved Gas Transport Ocean-Atmo Heat Exchange Ocean-Atmo Momentum Exchange Ocean-Atmo Gas Exchange Surface Mixing - Physical Surface Mixing - Chemical Surface Mixing - Biological Plate scale deformation Seafloor Fluid flow Seafloor Chemical/Heat Flux Seafloor Microbial Productivity Seafloor Deformation Regional/Local Geodynamics Tectonics & Hydrate C Flux Oceanography & Hydrate C Flux Biology of Hydrate C Flux Climate & Water Column Structure Climate Effects on Chemistry Climate Effects on Biology Topographical Physical Mixing Topographical Chemical mixing Topographical Biological mixing Hypoxia Physics Hypoxia Chemistry Hypoxia Biology Physical Shelf/Slope Exchange Chemical Shelf/Slope Exchange Biological Shelf/Slope Exchange Global Biogeochemistry and Carbon Cycling Ocean-Atmosphere Exchange Ocean Circulation, Mixing, and Ecosystems Fluid-Rock Interactions and the Subseafloor Biosphere Plate-Scale Seismology and Geodynamics Gas Hydrates Climate Variability and Ecosystems Ocean Mixing & Rough Topography Hypoxia on Continental Shelves Shelf/Slope Exchange 9 May 2015
OOI Science Prospectus Instruments 10 May 2015
Data Evaluation Schedule - Construction Daily: 9:00am Daily integration call Daily team meeting to discuss progress, issues, and tasks for the day Evaluate data (see Evaluation Procedures slide) Check in and re-assess status Weekly: Meet to conduct team evaluation of data plots, write up summary report 11 May 2015
OOI Data Reviewed to Date Pioneer (13 out of 24 instrument classes): Gliders (5): multiple deployments, telemetered and recovered CTD, Fluorometer, PAR, O2, ADCP (partial), Engineering Profilers (5): multiple deployments, telemetered and recovered CTD, Fluorometer, PAR, 3D Point Velocity, ADCP (partial), Engineering Surface Moorings (2): one deployment, telemetered Seafloor pressure, CTD (salinity only), Point Velocity (incorrect values), Air-Sea pCO2 (partial pressure only) Global (8 out of 21 instrument classes): Station Papa: Gliders (3): telemetered and recovered - CTD, O2 Surface Moorings (2): DO, Fluorometer, pH Irminger: Surface Moorings (1): CTD, DO, Fluorometer, pH, Point Velocity, ADCP NOTES Reviewed does not mean approved Nov. Jan. (Drops 1-2) evaluations focused on every instrument on every platform. Drops 3-5 focus on a single example of each to prove that drivers, calibration tables, ingest, L1 & L2 processing all produce scientifically reasonable output 12 May 2015
OOI Data Reviewed to Date, cont. Endurance (16 out of 25 instrument classes): Gliders (8): multiple deployments, telemetered and recovered CTD (no density), Fluorometer, PAR, O2, ADCP (partial), Engineering Wire-Following Profilers (1): CTD only (no density), Engineering Surface-Piercing Profilers (1): CTD, Nitrate, Optical Attenuation/Absorption (bad data) Surface Moorings (1): ADCP, pH, Spectral Irradiance, Point Velocity, DO, Fluorometer, Surface Waves Cabled Array (20 out of 34 instrument classes): Group 1B (7): seafloor test data CTD (pumped and profiling), O2, Fluorometer, PAR, Temperature-Resistivity (broken instrument), Point Velocity, ADCP Group 2A (3): seafloor test data CTD, O2, Nitrate (bad data), Temperature-Resistivity (broken instrument) Group 3 (5): seafloor test data CTD, O2, Seafloor pressure, Spectral Irradiance, 3D Thermistor Array Group 4 (3): seafloor test data Seawater pCO2, pH, 3D point velocity, VADCP (5-beam), D1000 (thermistors), Bottom Pressure-Tilt NOTES Reviewed does not mean approved Nov. Jan. (Drops 1-2) evaluations focused on every instrument on every platform. Drops 3-5 focus on a single example of each to prove that drivers, calibration tables, ingest, L1 & L2 processing all produce scientifically reasonable output 13 May 2015
Data Evaluation Schedule O&M Daily: Investigate overnight issues Daily team meeting to discuss progress, identify QC alerts and alarms, assign tasks for the day Split into small groups to evaluate and conduct QC checks on data (see Evaluation Procedures) Check in to re-assess status Continue QC work Weekly: Evaluator contact with designated IO reps Group evaluation of data plots and science discussion Bi-Weekly/Monthly: Draft group report on data quality and metrics 14 May 2015
Current Data Evaluation Procedures & Tools 1. 2. Script scrapes uFrame server for active links, creates list of available data Python script downloads NetCDF files of available data (as long of a time period as possible, ideally 1 week to 1 month) Plot all data, 1 week, 1 day, and 1 hour for each data product using Python Specialized programs (such as Panoply) used to create plots for instruments like ADCPs with binned or other non-standard data formats Final Python tool imports plots into a Word document Data team reviews for completeness, data gaps, unit errors, out of order time stamps, scientific validity, etc. Team annotates plots using highlight tool, text, Google document Google document summary combined with plots to create final data evaluation report document, submitted to Integration Team Lead Data issues entered into Redmine as trouble tickets by Data Manager 3. 4. 5. 6. 7. 8. 9. 15 May 2015
O&M Data Evaluation Procedures & Tools 1. 2. Check GUI for active platforms, list of available data, QC alerts Python script downloads NetCDF files of available data (as long of a time period as possible, ideally 1 week to 1 month) or uses GUI to create plots Plot all data, 1 week, 1 day, and 1 hour for targeted data products Data team conducts quick reviews for completeness, data gaps, unit errors, out of order time stamps, scientific validity, etc. Consult Science Oversight Committee and outside experts for deep dives Team annotates plots and datasets using GUI annotation and event tool Data issues entered into Redmine as trouble tickets by Evaluators and Data Manager; QA issues referred to IO s via SOC Monthly data evaluation report document (including metrics) submitted to CI Project Manager, Ocean Leadership, and NSF 3. 4. 5. 6. 7. 8. 16 May 2015