Ohio State and Local Tax Composition FY 2021 Analysis
Discover the breakdown of Ohio's state and local tax revenue sources for FY 2021, including sales taxes, property taxes, and individual income taxes. Ohio relies heavily on sales taxes, contributing significantly to the total tax revenue. Explore how Ohio compares to neighboring states in terms of tax revenue as a percentage of personal income.

Uploaded on | 0 Views
Download Presentation

Please find below an Image/Link to download the presentation.
The content on the website is provided AS IS for your information and personal use only. It may not be sold, licensed, or shared on other websites without obtaining consent from the author. If you encounter any issues during the download, it is possible that the publisher has removed the file from their server.
You are allowed to download the files provided on this website for personal or commercial use, subject to the condition that they are used lawfully. All files are the property of their respective owners.
The content on the website is provided AS IS for your information and personal use only. It may not be sold, licensed, or shared on other websites without obtaining consent from the author.
E N D
Presentation Transcript
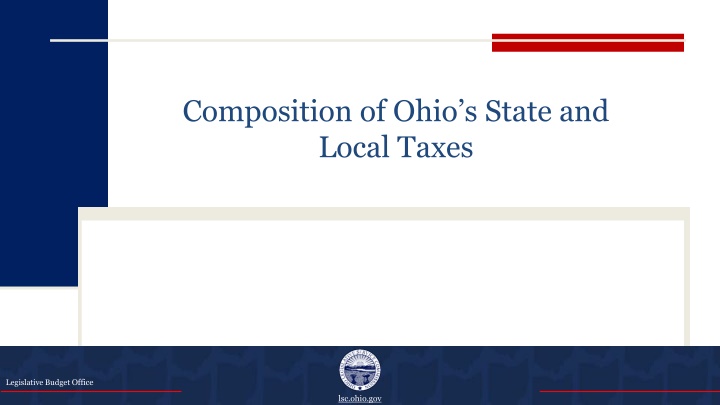
Composition of Ohios State and Local Taxes Legislative Budget Office lsc.ohio.gov lsc.ohio.gov
Ohio relies heavily on sales taxes for state and local government tax revenue Ohio Combined State and Local Tax Revenue by Source, FY 2021 U.S. Combined State and Local Tax Revenue by Source, FY 2021 All Total: $62.85 billion Total: $2,103.24 billion Other Taxes 11% Property Taxes 29% Individual Income Tax 26% All Other Taxes 5% Property Taxes 30% Sales Taxes* 40% Individual Income Tax 26% Sales Taxes* 33% *Sales taxes include general state and local sales tax and gross receipts taxes on sales of specific products, including tobacco products, alcoholic beverages, motor fuels, and utility services. Source: U.S. Census Bureau In FY 2021, state and local taxes on sales, property, and individual income in Ohio raised about 95% of total tax revenues. For all U.S. states in total, state and local taxes on sales, property, and individual income raised about 89% of total tax revenues. State taxes and local taxes accounted for 56% and 44%, respectively, of Ohio s combined state and local tax revenue in FY 2021. For the U.S. as a whole, state taxes were 60% of combined state and local tax revenue while local taxes were 40% of the combined total. lsc.ohio.gov lsc.ohio.gov Legislative Budget Office
Ohios sales tax receipts as a percentage of personal income exceed the average of neighboring states and the national average State and Local Tax Revenue as a Percent of Personal Income, FY 2021 In FY 2021, Ohio s general and selective sales tax receipts were 3.8% of total personal income, which was higher than the national average (3.3%) and was also higher than the average of its five neighboring states (3.4%). Selective sales taxes apply to specific products, including motor fuel, alcoholic beverages, tobacco products, and public utilities. Ohio s state and local individual income tax receipts as a percentage of total personal income were 2.5%, lower than the U.S. average (2.6%), and also lower than the average of its five neighboring states (2.8%). Ohio s percentage was 3.4% in FY 2008, but has been decreasing in subsequent years due primarily to income tax policy changes. Ohio s property taxes were 2.8% of total personal income, which was lower than the national average (3.0%), but higher than the average of its five neighboring states (2.4%). 4.0% 3.8% 3.4% 3.5% 3.3% 3.0% 3.0% 2.8% 2.8% 2.6% 2.5% 2.4% 2.5% 2.0% 1.5% 1.0% 0.5% 0.0% General & Selective Sales Sources: U.S. Census Bureau; Bureau of Economic Analysis Individual Income Property Ohio U.S. Neighboring States lsc.ohio.gov lsc.ohio.gov Legislative Budget Office
Ohios state and local governments rely less on income taxes as a percent of personal income than most neighbors In FY 2021, Ohio s individual income tax receipts were 2.5% of total personal income, which was higher than Michigan, but lower than Indiana, Kentucky, Pennsylvania, and West Virginia. Ohio s general and selective sales tax receipts were 3.8% of total personal income, which was the same as Indiana, but higher than West Virginia, Kentucky, Pennsylvania, and Michigan. Ohio s property tax receipts were 2.8% of total personal income, which was higher than Kentucky, Indiana, West Virginia, and Pennsylvania, but lower than Michigan. State and Local Tax Revenue as a Percent of Personal Income for Ohio and Neighboring States, FY 2021 General & Selective Sales State Individual Income Property Ohio 3.8% 2.5% 2.8% Indiana 3.8% 3.2% 2.2% Kentucky 3.5% 3.1% 2.0% Michigan 2.9% 2.3% 3.0% Pennsylvania 3.2% 2.7% 2.7% West Virginia 3.7% 2.7% 2.3% Sources: U.S. Census Bureau; Bureau of Economic Analysis lsc.ohio.gov lsc.ohio.gov Legislative Budget Office