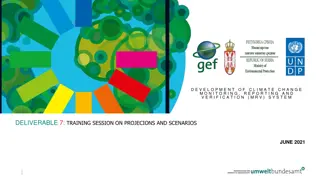
Oil & Gas Emissions Projections for 2023 and 2028
Background information on state SIPs, EPA air quality modeling, and recent energy sector changes influencing oil and gas emissions projections. Exploring the MARAMA projection method, AEO data usage, and plans for near-term modeling review.

Download Presentation

Please find below an Image/Link to download the presentation.
The content on the website is provided AS IS for your information and personal use only. It may not be sold, licensed, or shared on other websites without obtaining consent from the author.If you encounter any issues during the download, it is possible that the publisher has removed the file from their server.
You are allowed to download the files provided on this website for personal or commercial use, subject to the condition that they are used lawfully. All files are the property of their respective owners.
The content on the website is provided AS IS for your information and personal use only. It may not be sold, licensed, or shared on other websites without obtaining consent from the author.
E N D
Presentation Transcript
Updated Oil & Gas Emissions Projections for 2023 and 2028 1
Background Information 110 SIPs for the 2015 ozone NAAQS are due from states in October 2018 Regional Haze SIPs are due from states in 2018 or 2021 EPA is planning to conduct near-term air quality modeling to provide information which the states can use to inform the development of these SIPs Ozone contribution modeling for a 2023 projection year, the attainment date for moderate ozone nonattainment areas PM source sector contribution modeling for a 2028 projection year, the regional haze glide path target date Results of these model applications are expected to be provided by EPA to the states later this year 2
Context At a June 20/21 meeting between MJOs and EPA, the MJOs requested that EPA update the projection factors for oil and gas emissions for this near-term modeling in view of the recent changes in the energy sector which have affected the expected growth in oil and gas production and projected emissions in the US We investigated the use of applying MARAMA projection method to other Supply Regions in Lower48 states AEO tables used were identified and methodology explained Use of this method seems feasible Method computes State-SCC projection factors for each Supply Region (slide 5) Which AEO case to use? 2014, 2015 and 2016 have pretty significant differences Very little difference between 2016 reference case and 2016 reference case without CPP RECOMMENDATION: Use AEO 2016 reference case data to compute growth factors by supply regions 3
Plans / Timing for Method Review To meet the target date for providing air quality modeling information to states, EPA must begin modeling for 2023 and 2028 later this summer. We request that the Oil & Gas Committee to review the information in this package and provide by August 12, 2016 any concerns regarding the use of the MARAMA approach with the AEO 2016 reference case to project oil and gas production data for the near-term modeling Documentation on MARAMA approach is here: http://www.marama.org/technical- center/emissions-inventory/2011-2017-beta-regional-emissions-inventory Alternative data (derived using other than the above approach) should be provided to Vukovich.Jeffrey@epa.gov by August 18, 2016 in the form of a spreadsheet of state or county x SCC projection factors plus a brief description of how they were computed 4
2015 and 2016 are similar to 2014 but Rocky Mt and Dakotas are aggregated and Texas is split differently 5
Summary: Oil and Gas Projections for year 2023 & 2028 Factors will be for each Supply Region Use of the AEO 2016 reference case is recommended 2016 reference case and 2016 reference case without CPP are coincident in the time series for oil all Supply Regions, and nearly so for gas EPA will be reviewing available/appropriate control factors to apply for 2023 & 2028 that would be applied on top of the growth factors Send general comments on the approach ASAP (by August 12) to Vukovich.Jeffrey@epa.gov Send any alternative state x SCC or county x SCC factors to Vukovich.Jeffrey@epa.gov by August 18, 2016 22