Okun's Law Revisited: New Evidence on Cyclical Unemployment in Free State Province
Dive into the dynamic relationship between cyclical unemployment and output trade-offs in the Free State Province using the NARDL model. Explore the challenges faced by policymakers amid persistent high unemployment rates despite economic growth initiatives. Gain insights from empirical data analysis and recommendations for future policy strategies.
Download Presentation

Please find below an Image/Link to download the presentation.
The content on the website is provided AS IS for your information and personal use only. It may not be sold, licensed, or shared on other websites without obtaining consent from the author.If you encounter any issues during the download, it is possible that the publisher has removed the file from their server.
You are allowed to download the files provided on this website for personal or commercial use, subject to the condition that they are used lawfully. All files are the property of their respective owners.
The content on the website is provided AS IS for your information and personal use only. It may not be sold, licensed, or shared on other websites without obtaining consent from the author.
E N D
Presentation Transcript
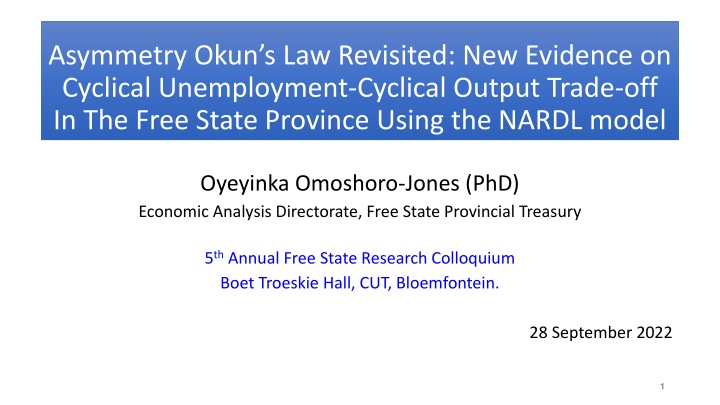
Asymmetry Okuns Law Revisited: New Evidence on Cyclical Unemployment-Cyclical Output Trade-off In The Free State Province Using the NARDL model Oyeyinka Omoshoro-Jones (PhD) Economic Analysis Directorate, Free State Provincial Treasury 5thAnnual Free State Research Colloquium Boet Troeskie Hall, CUT, Bloemfontein. 28 September 2022 1
Presentation Outline Motivation Literature: Empirical & Theoretical The Model: Dynamic NARDL Data Empirical Results: Baseline & Sensitivity Analysis models Conclusion & Policy recommendation 2
Introduction & Motivation Since 1994, high unemployment rates and low economic growth is persistent, and continued to pose a considerable challenge for the national government and policymakers alike. To improve general welfare, reduce the persistently high unemployment rate (<15%) and stimulate economic growth (>6%), South African government has introduced six prominent policies: (i) RDP (1994) (ii) GEAR (1998), (iii) ASGISA (2004), (iv) JIPSA (2007), (v) NGP (2010), (vi) NDP (2014) So far, the implemented national policies have yield a modicum of success in stimulating economic growth only in the 2000s (i.e., 2002 to 2005) without any notable impact on unemployment rate Between 1994-2019, on average, unemployment rate remains above 24%, while GDP growth is below 2% in South Africa (SA). Recent labour data shows that youth unemployment has outpaced adult unemployment, surging to 41% in 2019 (from 35.9% in 2014), with adult unemployment rising to 19% in 2019 (from 15.7% in 2014) (StatsSA, 2019). 3
Fig.1: Evolution of real GDP and Unemployment growth rates in FS & SA, 1990-2019 Data source: StatsSA, IHS Markit Regional eXplorer (ReX). Author s estimation 4
Introduction(2) Among the nine SA provinces, Free State province has the highest unemployment rate (>30%) and weak economic growth (<2.5%), particularly since 2011. Btw 2014-2019, FS recorded the highest unemployment of about 22.2% among the active working-age population (15-64yrs). Labour force participation rate and absorption rate remains unchanged at 60% and 40%, respectively. Theoretically, an increase in economic growth should lead to a reduction in unemployment rate, as total productivity and demand for labour rises to offset the direct increase in household consumption. This widely accepted regularity and empirically proven notion is referred to as the Okun s Law (Okun, 1962). Thus, inability of an increase in economic activity to reduce unemployment rate at the national and provincial level, creates a conundrum for policymakers on how to (i) formulate and implement an effective pro-growth macroeconomic policies, (ii) determine optimal growth rate to required to lower unemployment rate, and (iii) achieve a sustainable and inclusive growth. 5
Motivation Empirical studies examining the asymmetric relationship (inverse unemployment rate and output growth nexus) in South Africa (SA) remains scanty. Using different sophisticated econometric models, evidence supports the existence of an inverse asymmetric Okun s Law between unemployment and output in SA (Geldenhuys and Marinkov, 2007; Mazorodze and Siddiq, 2018; Phiri, 2014). Up till now, similar empirical inquiry at the provincial level has received no attention, except the recent work of Kavase and Phiri (2020). This type of analytical exercise is considered very important because: (i) economic activity at the provincial levels are chief contributor to the national GDP, & (ii) the extent of labour market participation/absorption rate are key determinants of the national (aggregated) unemployment rate. In particular, Kavase & Phiri (2020) finds evidence for asymmetric relationship between unemployment and output in both the short-run and long-run for only KZN and Gauteng, and short-run asymmetries in the rest of provinces, except the Free State province. These authors concludes that an increase in economic growth in FS would not translate into a reduction in unemployment rate. But, KP(2020) study suffers some shortcomings (i) built models do not account for structural shocks---erroneous conclusion on asymmetric relationships among variables, (ii) use only one filtering technique---the robustness of decomposed cyclical series are not confirmed. 6
Motivation(2) Fig. 1 gives the evolution of unemployment rate-economic growth nexus in FS characterized by 3 phases: (i) pre-recession period (2000-2002)--inverse relationship consistent with Okun s Law, (ii) post-recession recovery period (2010 to 2014) reveals a sharp increase in unemployment rate and marginal increase in output growth, and (iii) post-recessionary period (2014 to 2018)-- marked increase in unemployment rate and decline in output. Phases 2 and 3 are inconsistent with theory. Against this backdrop, this present study seek answer to the following questions: (i) Does Okun s Law holds for FS or not?(ii) What is the nature of relationship between unemployment and output in the FS? We employed the non-linear autoregressive distributed lag (NARDL) of Shin et al. (2014), which allows for simultaneous modelling of asymmetries and cointegration in both the long-run and short-run irrespective of the integrating order of variables. For robustness, two different detrending techniques (which includes Hodrick- Prescott (1997; HP filter) and Corbae-Ouliaris (2006; CO filter)) are used to generate cyclical growth series of unemployment and output. 7
Literature: Theoretical background Okun (1962) advanced the widely accepted empirical relationship between unemployment rate and real gross national product (GNP). He found a 3 percentage point increase in GNP (proxy for economic growth) reduces unemployment rate (UR) in the U.S, suggesting a 3:1 trade-off ratio. Assumes a linear (symmetric) relationship among variables. Okun s Law links activity in the goods market to activity in the labour market over the business cycle (Sillvapule et al. 2004) Okun s coefficient measures the responsiveness of unemployment rate to output growth, reflecting cost of unemployment in terms of output, which allow policymakers to understand how labour market adjust to changes in productivity, and how to design an optimal policy mix. Combined with Phillip curve produces the aggregate supply curve (AS), linking inflation, unemployment and economic growth (Prachowny, 1993; Moosa, 1997). AS curve is useful for inflation targeting. Okun s Law (or Okun s relationship) has become an accepted empirical regularity in the burgeoning empirical literature (see, Gordon, 1984; Palley, 1993, Attfield & Silverstone, 1998), and found to hold in many advanced and developing countries/regions (Ball et al. 2017; Freeman, 2000; Sogner and Stiassny, 2002). 8
Theoretical background(2) Structural changes due to external shocks causes variability in Okun s coefficient in different regions/countries (Palley, 1993; Lee, 2000; Apergis and Rezitis, 2003; Owang and Sekphosyan, 2012). But, the inverse unemployment-output trade-off remains relatively stable (Valadkhani and Smyth, 2015; Weber, 1995; Sogner and Stiassny, 2002) Existing studies largely focus on the existence of a symmetric relationship between unemployment rate and economic growth Okun s correlation. But, this widely-accepted assumption may lead to: (i) ineffective (stabilization and structural) policy formulation & labour market reform (Sillvapulle et al. 2004), particularly in developing countries with unstable economic growth and restrictive labour market, and (ii) forecasting errors and model misspecification (Harris and Silverstone, 2001). To a large extent, changes in economic growth and unemployment rate have been found to be asymmetric over business cycle during expansionary periods (upswings) and contractionary period (downswings). 9
Theoretical background(3) Possible theoretical arguments for asymmetric Okun s relationship includes: Hysteresis hypothesis (Blanchard and Summers, 1987)--during economic recovery period, employers are more risk-averse, hire less workers during expansionary periods after recession. Negative output shock vs positive output shock Labour hoarding (Palley, 1993) Firms hoard labour (cut number of work hours worked or reduced overtime) or spread labour during recessionary periods, causing unemployment rate to be irresponsive to changes in output during economic downswing (recession). Highly protected labour market--Labour unions prevent labour shedding, retrenchment and/or early retirement Resultantly, cyclical output shocks may have a permanent effect on structural unemployment, hence labour market does not return to pre-recession phase. Subsequent studies have reported lower Okun s relationship trade-off ratio of 2:1 (Freeman, 2000; Mankiw, 1994; Gordon, 1998). 10
Literature: Empirical Evidence Growing numbers of empirical studies have found concrete support for nonlinear unemployment rate-output tradeoff in the advanced countries, which includes the G7 countries (Shin & Greenwood-Nimmo, 2014; Holmes and Silverstone, 2006; Cuaresma, 2003; Altissimo and Violante, 2001; Harris and Silverstone, 2001), & OECD countries/regions (Tang and Bethencourt, 2017; Huang and Yeh, 2013; Viren, 2001; Lee, 2000). Several studies have argued that provincial-level analysis provides a better picture of Okun's law (see Apergis and Rezitis (2003) for Greek regions; Adanu (2005) for Canadian provinces, Villaverde and Maza (2009) for Spanish provinces, Huang and Yeh (2013) for 8 US regions; Durech et al. (2014) for provinces in the Czech Republic and Slovakia, and Guisinger et al. (2018) for US states. 11
Empirical Methodology & Model Specification Generally, the Okun s Law assume a bivariate and symmetric model consisting of unemployment rate and output growth. Empirical modelling of the Okun s Law typically takes the form of (i) difference model (differenced series of variables), and (ii) gap model (cyclical components of variables) The gap model is most preferred since it captures the movements of unemployment around the natural rates of unemployment due to changes in actual output around its trend growth (see, e.g., Ball et al. 2017). A percentage rise in output above its trend leads to a fall in unemployment rate below its natural rate of unemployment. For our application, we consider a bi-variate gap model in the form: ( ) t t t t t u u y y = + + < 0 Eq.(1) * * 0 = + + g t g t u y Eq.(1) expressed in as a reduced equation: 0 t ty tu where and are observed unemployment rate and real (actual) output growth rate; * * tu ty and denotes natural rate of unemployment, and potential output respectively. 12
Model specification: Dynamic NARDL From the above, cyclical unemployment rate (unemployment gap) is captured by and cyclical output (output gap) is accounted for by Parameter is the Okun s coefficient, and is the stochastic error term. * t g t y y y * t g t u u u t t t To estimate NARDL model, consider a dynamic unrestricted ARDL (p,q) model of Pesaran et al. (2001) in the form: 1 2 and 1 p q = + + + + + ECT + g t g t g t g t k g t k Eq.(3) u u y u y 0 1 1 2 1 1 2 1 t t = = 1 1 k k 2 is a lag operator; are short-run cofficients with being the long-run ECT where coefficient (normalized on ), and is the one-lagged period error correction term, and measures the adjustment speed of reversion to long-run equilibrium following an external shock to the bivariate system. 1 t 13
Dynamic NARDL specification(2) Following Shin and Greenwood-Nimmo (2014), to account for hidden cointegration (Granger and Yoon, 2002), short-run and long-run asymmetries are incorporated into Eq (3) by defining as a vector such that which yields an asymmetric long-run regression in represented as: t t t t u y y = + + + + g = + + g t g t g t g t ty y y y y k 1 + + 2 g g g (0, ) Eq.(4) g ty N t + g ty where and are nonlinear long-run parameters, while and are partial sum process of positive and negative changes in cyclical ouput defined as: t t g g t k k k t t g g t k k k = = + + = = g k max( ,0) y y y = = 1 1 = = g k max( ,0) y y y 1 1 Substituting Eq.(4) into Eq (3) yields dynamic NARDL modelled as: 1 1 p p q + + + + = + i t k u + + + + + + ECT + = g t g g t k g t k g t k g t k g t k ( ) for 1,..., Eq.(5) q u y y u y y k 0 1 k k i k k t t = = = 1 1 0 k k k 14
Dynamic NARDL specification(3) In Eq. 5, k +and t is an IID process with zero mean and constant variance, k / = are the asymmetric long-run coefficients. Note that reliable estimates of k are the asymmetric distributed-lagged parameters, is the autoregressive parameter, and + and / = k are long- Parameters , , 2. k + + g +and are short-run coefficients. Whereas run coefficients, while and k g + + , , k k k are computed by standard OLS. and, k To account for structural changes due to external or endogenous shocks, we include qualitative dummy variables in the estimated model in Eq.5, which yields: 1 1 p p q + + + + = + + + + + + + g t g t k g t k g t k g t k g t k g t k ( ) u u y y D u y y D t k t k 1 2 i k k i k k = = = 1 1 0 k k k 2 are the coefficients of the dummy variable accounting for structural changes. In tD encapsulates all the break dates (BD) identified by the Breakpoint unit root test, and specified such that 1 BD and 0 otherwise. + ECT 1 and + 2 where (0, ) Eq.(6) N 1 t t t our case, t D = for t 15
Data Annual series covering the period 1999 to 2009 for: Nominal GDP (@constant prices, 2010=100), and total unemployment, sourced from StatsSA Nominal GDP per capita (@constant prices, 2010=100) obtained from Regional eXplorer database (IHS Global markit). Real GDP and real GDP per capita variables used in the estimated models were adjusted for inflation using sourced CPI (2010=100) data from StatsSA Cyclical components (or gap variables) are extracted from the total unemployment, real GDP and real per capita GDP using (i) HP filter (time-domain) and (ii) CO filter (frequency domain). Utilizing two different filters provides robustness check for filtered cyclical data, estimated dynamic nonlinear models, and reliability of results. Growth rates of the cyclical components of (i)real GDP, (ii) real GDP per capita and (iii) total unemployment series are used in the constructed dynamic NARDL models. Built 4 dynamic NARDL models, one for each detrending methods 2 baseline models containing filtered cyclical series of real GDP growth rate and total unemployment using HP filter and CO filters 2 dynamic models for robustness check, consisting of filtered cyclical data of real GDP per .capita and total unemployment using HP and CO filters. 16
Evolution of cyclical unemploymentcyclical output nexus in the Free State during the business cycle, 1994-2019 (baseline models with HP & CO filtered data) Fig.3 Estimated cyclical real GDP and cyclical unemployment using CO filter Fig.2. Estimated cyclical real GDP and cyclical unemployment using HP filter. Source: Author s estimation (Eviews 10) 17
Empirical Results (Baseline dynamic models (1)) Evidence of a long-run relationship between cyclical components of unemployment and output in FS. Bound-testing approach (Pesaran et al. 2001) shows values for F-stats > F-critical value for upper bounds, confirming that cyclical variables are cointegrated, i.e., long- run relationship exists Evidence of a partial long-run asymmetry among cyclical components Statistically significant long-run coefficients of -0,87 (HP filter model) and -0,72 (CO filter model) for positive changes in cyclical output, supporting the existence of an inverse asymmetric relationship between cyclical unemployment and cyclical outputin FS, keeping with Okun s relationship. This finding implies that unemployment is only responsive to positive change in cyclical output during sustained economic expansion in FS province, overtime. Insignificant long-run coefficients of -0,40 (HP filter model) and -0,33 (CO filter model) for negative changes in cyclical output. This result suggest a positive correlation between unemployment and output growth, contradicting Okun s Law. For similar result for SA, see e.g., Sere (2020), Kavase & Phiri (2020), and Marinkov & Geldenhuys (2007) 18
+ g t = g g t g t u ( y ( , ) ) f y U t PSS F Evidence of Asymmetric Cointegration: NARDL Table 3. Bounds F-test for nonlinear cointegration (baseline models) Dependent variable: + = g t F g t g t Function: y ( , ) u f y g tU F-statistic ( ) De-trending method Dynamic specification Conclusion Cointegration asymmetric relationship exists Cointegration asymmetric relationship exists PSS HP filter NARDL (2,2,1,1) 20.712 CO filter NARDL (2,2,1,1) 7.6087 Asymptotic CVs (k = 3)1: HP and CO gap variables 1% 5% 10% I(0) I(1) I(0) I(1) I(0) I(1) 5.333 7.063 3.71 5.018 3.008 4.15 + + = = = F refers to the F-test of the joint null, 0, Note: I(0) and I(1) denotes the upper bound and lower bound levels, respectively. as in Pesaran et al. (2001). PSS k k Asymptotic CVs for the two NARDL gap models with HP and CO filtered data are tested based on Case III (unrestricted constant and restricted). 19
Empirical Results baseline NARDL models(2) Possible reasons for evidence of a positive correlation between cyclical unemployment and cyclical output in FS includes: (i) The provincial government is the major employer of labour, thus crowds out private sector employment, (ii) rigid labour union negotiations, and employment protection laws that inhibits government from firing workers during economic recession (see, Moosa, 2008). Asymmetric long-run coefficients (L+) are statistically significant and positive values of - 0,57 (HP filter model) and -0,53 (CO filter model), indicating that an economic upturn of 1,73% and 1,88% is required to lower unemployment rate by 1% in FS. Wald statistics: The values of F-stats for long-run (WLR) symmetry of 32.5 (HP filter) and 11.6 (CO filter) are positive and highly significant (i.e., rejects null hypothesis of symmetric cyclical unemployment-cyclical output trade off) Evidence of short-run asymmetry Found contemporaneous impacts of a positive and negative changes in cyclical output on unemployment. 1% change in (one period lagged) positive cyclical output is contemporaneous associated with decrease in cyclical unemployment between 0.52 (0,83 and 0,56) percentage point, during economic recession in FS. + = ) ( W LR k k 20
Dynamic NARDL Results (1): Baseline models (y) Table 4. Dynamic asymmetric estimation of cyclical unemployment-cyclical output estimation (baseline models) Dependent variable: t U HP filter Variable Coefficient Standard error t-ratio (p-values) g tu -1.520 0.186 -8.133 (0.000) g ty -0.876 0.245 -3.566 (0.000) g ty 0.408 0.240 1.679 (0.123) 0.921 0.142 6.447 (0.000) -1.636 0.294 -5.548 (0.000) 1.862 0.316 5.892 (0.000) -0.529 0.172 -3.076 (0.013) -0.831 0.350 -2.371 (0.041) -15.341 2.758 -5.561 (0.000) -9.699 2.871 -3.377 (0.041) ECT -1.520 0.144 10.510 (0.000) Constant 39.626 6.713 5.902 (0.000) yL+ -0.576 0.156 -3.680 (0.005) yL 0.2686 0.144 1.862 (0.095) g Variable 1 1 1 ECT Constant CO filter Standard error 0.253 Coefficient -1.357 t-ratio ( p-values ) -5.357 (0.000) g tu g ty g ty 1 + + g tu g ty g ty g ty g ty tD -0.720 0.365 -1.971 (0.080) 1 g tu g ty g ty g ty g ty tD 0.314 0.335 0.936 (0.373) 1 0.934 0.208 4.487 (0.001) 1 + 1 + -1.554 0.457 -3.395 (0.007) 1.857 0.449 4.131 (0.002) + + -0.418 0.256 -1.629 (0.137) 1 1 -0.563 0.468 -1.201 (0.260) 1 1 tD tD 10.395 3.172 -3.277 (0.009) 1 1 1 1 -7.577 1.938 -3.908 (0.003) 2 2 -1.357 32.079 -0.530 0.193 9.125 0.268 -7.022 (0.000) 3.515 (0.006) -1.978 (0.079) 1 1 t t yL+ yL 0.231 0.227 1.015 (0.336) Diagnostic statistics 0.951 17.474 (0.000) 1.306 (0.520) 0.896 2.04 3.676 (0.159) F-statistic SC HET ARCH LR W 0.876 6.407 (0.005) 0.803 (0.669) 0.740 2.07 2.961 (0.227) 2 2 2 2 R F-statistic 2 SC 2 HET ARCH W R DW 2 NOR 2 FF W R R DW 2 NOR 2 FF W 2 2 0.763 (0.382) 2.620 (0.144) 1.309 (0.252) 2.124 (0.183) 32.567(0.000) 5.297 (0.021) 11.607 (0.000) 8.800 (0.003) LR SR SR k 21 +(i.e., (i.e., Note: Subscripts + and denotes the positive and negative partial sum processes, respectively. + + + = = ) and ) are the g g / / yL yL k +, respectively. g ) long-run coefficients associated with positive and negative changes of cyclical output( W and W refers to the Wald test for long-run y LR SR = + = = = 1 0 1 0 q i q i 2 2 2 2 2 symmetry (i.e., correlation, heteroscedasticity, normality, and function form (Ramsey s RESET), accordingly. Corresponding p-values in ( ) parenthesis ) and the additive short-run symmetry condition (i.e., ). and are the LM tests for serial + + , , , L L k k SC H ARCH NOR N FF y y
Empirical Results baseline NARDL models (3) Wald test: joint F-stats for additive sum of short-run asymmetry ( is statistically significant and positive at 5,29 (HP filter) and 8,80 (CO filter). Implies the rejection of null hypothesis of a symmetry cyclical output and unemployment trade-off in FS Negative and statistically significant error correction terms (ECT) ranges from -1,52 (HP filter model) to -1,37 (CO filter model) indicating a fast but oscillatory reversion of the system to a long-run equilibrium, within a year. For similar findings see, Kavase and Phiri (2020) and Narayan and Symth (2006). Notice that the negative coefficient of one-period lagged ECT falls between the acceptable -1 and -2 to ensure convergence of a bivariate cyclical gap models after an external shock to the system, in the short-run (Johansen, 1995). Dummy variables for both long-run (one-period lagged) and short-run (with first difference operator) has significant negative coefficients of -9,69 (HP filter model) and -7.57 (CO filter model). This finding suggest that dynamics of labour market and economic activity level in FS is strongly influenced by external shocks changes in total unemployment and fluctuations of cyclical outputs during economic expansion or recession is susceptible to structural and/or exogenous shocks propagated elsewhere. Built NARDL models passed post-modelling diagnostic tests, no evidence of serial correlation (BG test and DW), heteroscedasticity (ARCH-LM test), functional misspecification bias (RAMSEY RESET test) and residuals are normally distributed (Jacque-Bera test). CUSUM & CUSUMSQ test falls within the 5% significance line (i.e., 95 CV) confirming model stability (see paper) 22
Empirical Results (2): Sensitivity Analysis (models) Substitute real GDP with real per capita GDP No quantitative difference in obtained results compared with the baseline models for both the HF fitered data and CO filtered data. Evidence of asymmetry long-run relationship between cyclical unemployment and cyclical output (proxied by real GDP per capita) Bound-testing approach (Pesaran et al. 2001) shows values for F-stats > F- critical value for upper bounds, confirming that cyclical variables are cointegrated, i.e., long-run relationship exists Evidence of a partial long-run asymmetry Statistically significant long-run values of -0,87 (HP filter model) and -0,72 (CO model) for only positive changes in cyclical output. This finding is consistent with asymmetric Okun s relationship for advance and developing countries in the expanding literature. Insignificant positive long-run values of 0,40 (HP filter) and 0,33 (CO filter). This result indicates positive correlation between cyclical unemployment and cyclical output, contradicting Okun s Law. 23
Cointegration: NARDL (Sensitivity analysis model) Table 5. Bounds F-test for nonlinear cointegration (sensitivity analysis models) Dependent variable: + = g t F g t g t Function: yc ( , ) u f yc g tU F-statistic ( ) De-trending method Dynamic specification Conclusion Cointegration asymmetric relationship exists Cointegration asymmetric relationship exists PSS HP filter NARDL (2,2,1,1) 14.17898 CO filter NARDL (2,2,2,0) 6.516974 Asymptotic CVs (k = 3) for the estimated models with HP and CO filtered series 1% 5% 10% I(0) I(1) I(0) I(1) I(0) I(1) 5.333 7.063 3.71 5.018 3.008 4.15 Note: See, Table 3. 24
Empirical Results: Sensitivity Analysis models(2) The value of long-run coefficient (L+) of positive change in cyclical output is only significant and negative in HP filter model. L+ value of -0,49 indicates that an economic upswing of 2,03% is required to reduce unemployment by 1% in during a sustained economic upswings. Our finding of asymmetric Okun s coefficient of 2:1 trade-off ratio aligns with the results of Sogner (2001), Moosa (1997), Attfield and Silverstone, (1998) Evidence of short-run asymmetry- only in HP filter model Contemporaneous effects of changes in 1% changes in positive (negative) cyclical output per capita can reduce (increases) unemployment by 0,46 (0,99) percentage points in the short-run. One period lagged ECT is negative and statistically significant indicating reversion of the models to its long-run equilibrium following an external shock to the bivariate system, albeit the large coefficients of -1,42 (HP filter model) and -1.14 (CO filter) suggest rapid but oscillatory reversion of the model to steady state in less than a year after shock. Wald test for symmetric long-run (WLR) and additive short-run symmetries (WSR) rejects symmetric unemployment-GDP tradeoff in both long-run and short-run respectively, in the estimated NARDL models using HP filtered data and CO filtered data Model passed all post-estimation diagnostic tests- free from serial correlation (BG test and Dubin Watson value close to 2), ARCH test--no ARCH effects in residuals (heteroscedastic, and RAMSEY s RESET test confirms no functional form misspecification. CUSUM and CUSUM SQ for both HPF and COF models shows no deviation outside the 5% line of significance. 25
NARDL Results (2)-Sensitivity Analysis Model (yc) Table 4. Dynamic asymmetric estimation of cyclical unemployment-cyclical output estimation (baseline models) Dependent variable: t U HP filter Variable Coefficient Standard error t-ratio (p-values) g tu -1.520 0.186 -8.133 (0.000) g ty -0.876 0.245 -3.566 (0.000) g ty 0.408 0.240 1.679 (0.123) 0.921 0.142 6.447 (0.000) -1.636 0.294 -5.548 (0.000) 1.862 0.316 5.892 (0.000) -0.529 0.172 -3.076 (0.013) -0.831 0.350 -2.371 (0.041) -15.341 2.758 -5.561 (0.000) -9.699 2.871 -3.377 (0.041) ECT -1.520 0.144 10.510 (0.000) Constant 39.626 6.713 5.902 (0.000) yL+ -0.576 0.156 -3.680 (0.005) yL 0.2686 0.144 1.862 (0.095) g Variable 1 1 1 ECT Constant CO filter Standard error 0.253 Coefficient -1.357 t-ratio ( p-values ) -5.357 (0.000) g tu g ty g ty 1 + + g tu g ty g ty g ty g ty tD -0.720 0.365 -1.971 (0.080) 1 g tu g ty g ty g ty g ty tD 0.314 0.335 0.936 (0.373) 1 0.934 0.208 4.487 (0.001) 1 + 1 + -1.554 0.457 -3.395 (0.007) 1.857 0.449 4.131 (0.002) + + -0.418 0.256 -1.629 (0.137) 1 1 -0.563 0.468 -1.201 (0.260) 1 1 tD tD 10.395 3.172 -3.277 (0.009) 1 1 1 1 -7.577 1.938 -3.908 (0.003) 2 2 -1.357 32.079 -0.530 0.193 9.125 0.268 -7.022 (0.000) 3.515 (0.006) -1.978 (0.079) 1 1 t t yL+ yL 0.231 0.227 1.015 (0.336) Diagnostic statistics 0.951 17.474 (0.000) 1.306 (0.520) 0.896 2.04 3.676 (0.159) F-statistic SC HET ARCH LR W 0.876 6.407 (0.005) 0.803 (0.669) 0.740 2.07 2.961 (0.227) 2 2 2 2 R F-statistic 2 SC 2 HET ARCH W R DW 2 NOR 2 FF W R R DW 2 NOR 2 FF W 2 2 0.763 (0.382) 2.620 (0.144) 1.309 (0.252) 2.124 (0.183) 32.567(0.000) 5.297 (0.021) 11.607 (0.000) 8.800 (0.003) LR SR SR k 26 +(i.e., (i.e., Note: Subscripts + and denotes the positive and negative partial sum processes, respectively. + + + = = ) and ) are the g g / / yL yL k +, respectively. g ) long-run coefficients associated with positive and negative changes of cyclical output( W and W refers to the Wald test for long-run y LR SR = + = = = 1 0 1 0 q i q i 2 2 2 2 2 symmetry (i.e., correlation, heteroscedasticity, normality, and function form (Ramsey s RESET), accordingly. Corresponding p-values in ( ) parenthesis ) and the additive short-run symmetry condition (i.e., ). and are the LM tests for serial + + , , , L L k k SC H ARCH NOR N FF y y
Conclusion & Policy recommendation Our results concretely confirm the presence of Okun s Law in FS, and shows that the nature of cyclical unemployment-cyclical output trade-off is asymmetric (non-linear) Empirical evidence aligns with those in the international empirical literature (e.g., see, Viren, 2001, Lee, 2000, Crespo-Cuaresma, 2003) and majority of those focusing on SA (Marinkov & Geldenhuys, 2007; Phiri, 2014; Mazorodze & Siddiq, 2018), but at odds with Kavase and Phiri (2020), who find no evidence of asymmetric relationship between cyclical unemployment and cyclical output for FS in the long-run or short-run. Arguably, the result of this study is erroneous since the estimated model failed to account for structural breaks in data used. We find evidence of asymmetry in both the long-run and short-run, albeit a sustained increase in economic activity will reduce unemployment rate in FS. In the long-run, a 1% increase in positive changes in cyclical output during a (sustained) economic expansion can reduce cyclical unemployment by 0,7 to 0,86 percentage point. In the short-run, a 1% rise in positive (negative) cyclical output reduces (increases) between 0,52 and 0,40 (+0,99 and +0,56) percentage points. Okun s coefficient is negative and statically significant. For FS, an economic upswings of about 1,88% to 2,03% is required to lower unemployment by 1%; keeping with the 2:1 Okun s ratio. 27
Policy recommendationSupply side interventions The evidence of asymmetric cyclical unemployment-cyclical output trade-off explains why adopted policies have failed in SA, since they are based on symmetric assumption, i.e., demand-side policy intervention. By implication, macroeconomic policy in FS should follow a multiple-pronged approached that takes into consideration growth rates of output and unemployment based on both the supply-side and demand-side policy interventions (1) Supply side policy interventions (based on evidence of a long-run asymmetric trade-off) Reduce the size of the government (public sector) in the provincial labour market to enhance private sector employment growth a key driver of jobs. Incentivize private sectors to reduce labour market rigidities (e.g., for highly skilled workers) train low-skilled employees, hire inexperience workers, and offer internships ---creates a multiplier effects that can indirectly raise economic growth, total productivity and employment in the province Unemployment is mostly structural in nature (i.e., due to skill mismatch). This requires FS government to provide financial support (wholly or partially) to encourage self employment, development of business plans, business proposals and establishment of SMMEs 28
Supply-side & Demand side policy interventions Encourage the growth informal sector (60% of GDP contributions unrecorded) and business are easy to start with little financial support. Policymakers need to remove bureaucratic and administrative red-tapes on trading permits, company registration and stringent labour laws (2) Demand side policy interventions ( based on short-run asymmetry between cyclical unemployment and cyclical output) short-term to medium-term strategies. Increase public investment on infrastructure main focus on preventative maintenance of public buildings, road networks and highways --- improve labour participation rate since it creates transitory job opportunities for long-term unemployed and discouraged workers Continued to intensify the massification of government s flagship Public employment programmes such as EPWP and CWP, with focus on labour-intensive approach rather than capital-intensive (see Omoshoro-Jones, 2015, 2016). Actively monitor the implementations of PEPs to eradicate the problems of extended participation periods that disallow the recruitment of unemployed people in the community 29
Demand-side policy interventions (Contd). Demand side interventions ( based on short-run asymmetry between cyclical unemployment and cyclical output) short-term to medium-term strategies. Revitalize weaken productive sectors such as mining, agriculture and manufacturing sectors, which has the potential to absorb about 70% of unskilled labour to allow an increase in labour absorption and participation rates in FS. Implement prudent fiscal management reduce wasteful expenditure and improve collection of own revenue to improve service delivery. Deepen PPP allows technological and technical know spillovers crucial for sustainable economic growth. Nota bien: This paper has been published as: MPRA Working paper 107126, available at https://mpra.ub.uni-muenchen.de/107126/. Also downloadable from ResearchGate (https://www.researchgate.net/publication/350854672), and RePEc (https://ideas.repec.org/p/pra/mprapa/107126.html). To submitted for article publication at Journal of Applied Economic Sciences (JAES) for September 2021 (fall) issue. 30
Thank You Questions??? Email: yinkaoj@treasury.fs.gov.za Phone: 051 430 4065 (landline) 31
