Operating Reserve Demand Curve (ORDC) Enhancement Analysis Summary
Explore the analysis of potential modifications to the Operating Reserve Demand Curve (ORDC) suggested by the Technical Advisory Committee (TAC) for ERCOT. The discussion includes options to generate similar annual revenues to the bridging option for 2022, such as adjusting Real-Time On-Line Reserve Price Adder (RTORPA) floors and Value-of-Lost-Load (VOLL) levels. Dive into the details and implications of these enhancements as per the TAC-requested back-cast analysis.
Download Presentation

Please find below an Image/Link to download the presentation.
The content on the website is provided AS IS for your information and personal use only. It may not be sold, licensed, or shared on other websites without obtaining consent from the author. If you encounter any issues during the download, it is possible that the publisher has removed the file from their server.
You are allowed to download the files provided on this website for personal or commercial use, subject to the condition that they are used lawfully. All files are the property of their respective owners.
The content on the website is provided AS IS for your information and personal use only. It may not be sold, licensed, or shared on other websites without obtaining consent from the author.
E N D
Presentation Transcript
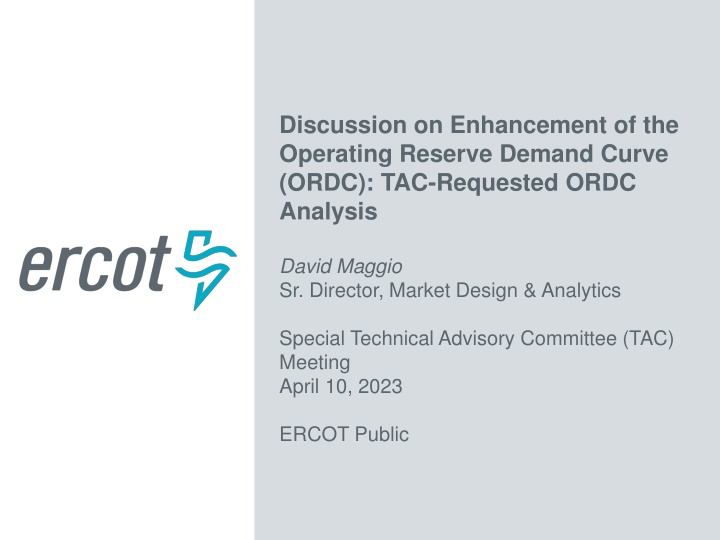
Discussion on Enhancement of the Operating Reserve Demand Curve (ORDC): TAC-Requested ORDC Analysis David Maggio Sr. Director, Market Design & Analytics Special Technical Advisory Committee (TAC) Meeting April 10, 2023 ERCOT Public
Recap Following the March 31, 2023, special TAC meeting, TAC requested additional back-cast analysis on potential modifications to ORDC that would yield similar annual revenues (~$500M) to ERCOT s recommended bridging option* for 2022, specifically: 1. Retaining the proposed $10/MWh Real-Time On-Line Reserve Price Adder (RTORPA) floor with On-Line ORDC reserves (RTOLCAP) at or below 7,000 MW and deriving an additional RTORPA floor to apply when RTOLCAP is at or below 4,000 MW that generates a similar additional revenue outcome (~$500M for 2022). 2. Removing all proposed floors and instead determining a level of Value-of-Lost-Load (VOLL) decoupled from the System-Wide Offer Cap (SWCAP) that yields a similar additional revenue outcome (~$500M for 2022). The following slides highlight these selected options as well as additional analysis that was requested. *Multi-step RTORPA floor: 6500MW @ $20/MWh & 7000MW @ $10MWh 2 ERCOT Public
Cases Considered ERCOT-preferred ORDC enhancement Step 1: $20/MWh RTORPA at 6.5 GW RTOLCAP and below. Step 2: $10/MWh at 7 GW RTOLCAP and below. TAC Option 1 Step 1: Derived floor at 4 GW RTOLCAP. Step 1 floor determined by targeting incremental revenue of ~ $500M for 2022 back-cast. Step 2: $10/MWh at 7 GW RTOLCAP. TAC Option 2 Raise VOLL until additional revenue due to the RTORPA adjustment reaches ~$500M for 2022 back-cast. 3 ERCOT Public
ERCOT-Preferred Option Analysis Adjusted Interval Summary Step 1: Step 2: Combined $20/MWh floor at 6.5 GW $10/MWh floor at 7 GW Year 2020 2022 2020 2022 2020 2022 Count 5,381 4,398 4,241 4,048 9,622 8,446 Avg. RTORPA increase ($/MWh) 13.71 14.45 9.37 9.43 11.80 12.04 Total energy dispatched (GWh) 21.1 19.2 16.6 17.5 37.7 36.7 Energy rev. increase ($M) 287.6 274.4 154.9 163.8 442.4 438.2 Headroom rev. increase ($M) 37.1 31.8 21.9 21.0 59.0 52.8 Total rev. increase ($M) 324.7 306.2 176.7 184.8 501.4 491.0 4 ERCOT Public
TAC Option 1 Analysis: Multi-step floor with Step 1 at 4 GW Adjusted Interval Summary Step 1: Step 2: Combined $1,550/MWh floor at 4 GW $10/MWh floor at 7 GW Year 2020 2022 2020 2022 2020 2022 Count 37 91 8,373 7,648 8,410 7,739 Avg. RTORPA increase ($/MWh) 355.69 414.5 7.78 8.01 9.31 12.79 Total energy dispatched (GWh) 0.2 0.5 32.7 33.0 32.9 33.5 Energy rev. increase ($M) 55.1 192.1 253.2 262.5 308.3 454.5 Headroom rev. increase ($M) 4.2 11.7 34.8 32.7 39.0 44.4 Total rev. increase ($M) 59.3 203.8 288.0 295.2 347.3 499.0 5 ERCOT Public
TAC Option 2 Analysis: VOLL Adjustment to $5,670/MWh Adjusted Interval Summary Year 2020 2022 Count 51,730 53,593 Avg. RTORPA increase ($/MWh) 2.43 1.62 Total energy dispatched (GWh) 195.8 225.3 Energy rev. increase ($M) 577.6 451.8 Online headroom rev. increase ($M) 47.3 31.1 Offline headroom rev. increase ($M) 25.5 31.1 Total rev. increase ($M) 650.4 500.4 6 ERCOT Public
Average Fuel Mix by Resource Type for Studied Years and During Intervals with Adjusted RTORPAs Proxy for distribution of additional revenue due to RTORPA adjustments. This approach is a better approximation for the ERCOT-preferred option given the consistency in adjusted RTORPA values. Energy % by Fuel Type Preferred Option Adjusted Intervals TAC Option 1 Adjusted Intervals TAC Option 2 Adjusted Intervals All intervals Resource Type 2020 2022 2020 2022 2020 2022 2020 2022 Natural Gas 45.85 54.61 54.40 50.25 42.64 53.28 53.02 48.18 Coal and Lignite 17.98 20.86 20.88 19.95 16.77 17.90 17.95 17.40 Nuclear 11.06 9.71 9.74 10.20 9.76 8.97 9.02 9.29 Energy Storage 0.01 0.02 0.02 0.01 0.12 0.20 0.19 0.14 Hydro 0.15 0.20 0.20 0.19 0.07 0.07 0.07 0.07 Wind 22.73 11.59 11.79 16.60 25.02 13.67 13.83 19.09 Solar 2.20 2.98 2.95 2.79 5.52 5.80 5.81 5.72 Other 0.01 0.02 0.02 0.01 0.10 0.11 0.11 0.10 7 ERCOT Public
Average Fuel Mix by Resource Age for Studied Years and During Intervals with Adjusted RTORPAs Proxy for distribution of additional revenue due to RTORPA adjustments. This approach is a better approximation for the ERCOT-preferred option given the consistency in adjusted RTORPA values. Energy % by Age Category Preferred Option Adjusted Intervals TAC Option 1 Adjusted Intervals TAC Option 2 Adjusted Intervals All intervals Age (Years) 2020 2022 2020 2022 2020 2022 2020 2022 0 10 30.24 33.28 24.87 27.10 24.95 27.17 27.32 29.89 10 20 37.24 23.09 38.57 22.88 38.58 22.90 37.81 23.17 20 30 11.16 21.12 11.35 24.35 11.35 24.29 11.22 22.95 30 40 11.75 11.37 11.60 11.12 11.64 11.16 11.72 11.22 40 50 8.77 8.92 12.08 10.88 12 10.85 10.73 9.87 50 60 0.63 1.94 1.17 3.22 1.13 3.17 0.89 2.53 60+ 0.22 0.28 0.37 0.46 0.36 0.45 0.31 0.37 8 ERCOT Public
Approximation of Additional Revenues by Resource Type and Age for the ERCOT-Preferred Option Additional Revenue ($M) Additional Revenue ($M) Study Year Study Year Resource Type 2020 2022 Age (Years) 2020 2022 Natural Gas 0 10 273.8 261.6 124.7 133.1 Coal and Lignite 10 20 104.6 87.9 193.4 112.3 Nuclear 20 30 48.7 44.0 56.9 119.6 Energy Storage 30 40 0.1 1.0 58.2 54.6 Hydro 40 50 1.0 0.3 60.6 53.4 Wind 50 60 58.1 67.1 5.9 15.8 Solar 60+ 14.9 28.5 1.9 2.3 Other 0.1 0.5 9 ERCOT Public
ERCOT-Preferred Option Incremental Revenue Breakdown by Month 10 ERCOT Public
TAC Option 1 Incremental Revenue Breakdown by Month 11 ERCOT Public
TAC Option 2 Incremental Revenue Breakdown by Month 12 ERCOT Public
ERCOT- Preferred Option Benefits Multi-step RTORPA floor: 6,500MW @ $20/MWh & 7,000MW @ $10MWh 1. Aligns with PCM: The back-cast analysis for 2020 and 2022 indicates that by applying these floors the total revenue increase would be in the $500M range. While we recognize the analysis does not account for behavioral changes, this level of increase aligns with the additional average revenue PCM would provide (as calculated by E3). 2. Targeted to the right resources at the right time: The back-cast analysis for 2022 confirms that when applying these floors the increase in revenue would be largely directed to dispatchable resources. In the preferred scenario, 80% of the revenue increase would be directed to dispatchable resources. The floor prices also have impact when ERCOT is seeing the greatest need for increased generator commitment. 3. Helps address RUC: Applying a floor that initially kicks in within the 6,500- 7,000MW range provides a self-commitment incentive better aligned with conservative operations. Adding multiple steps to the floor incorporates feedback provided by market participants, provides for tiering in the strength of the self-commitment signal, and provides some mitigation of risk for generators that self-commit. 13 ERCOT Public


