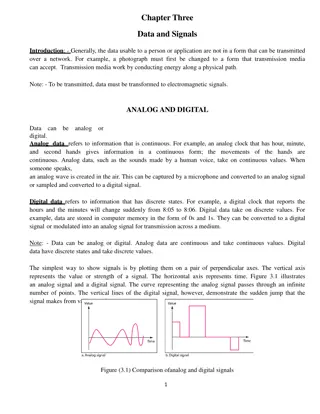
Optimal Receiver Design and Error Sources in Signal Processing
Explore the structure of optimal receivers for deterministic signals, demodulation techniques, detection methods, and sources of errors in received signals. Discover the steps in designing receivers to maximize SNR and minimize ISI.

Download Presentation

Please find below an Image/Link to download the presentation.
The content on the website is provided AS IS for your information and personal use only. It may not be sold, licensed, or shared on other websites without obtaining consent from the author. If you encounter any issues during the download, it is possible that the publisher has removed the file from their server.
You are allowed to download the files provided on this website for personal or commercial use, subject to the condition that they are used lawfully. All files are the property of their respective owners.
The content on the website is provided AS IS for your information and personal use only. It may not be sold, licensed, or shared on other websites without obtaining consent from the author.
E N D
Presentation Transcript
Lecture 1.30 Structure of the optimal receiver deterministic signals. Receiver Design: Demodulation Matched Filter Correlator Receiver Detection Max. Likelihood Detector Probability of Error
Sources of Error in received Signal Major sources of errors: Thermal noise (AWGN) disturbs the signal in an additive fashion (Additive) has flat spectral density for all frequencies of interest (White) is modeled by Gaussian random process (Gaussian Noise) Inter-Symbol Interference (ISI) Due to the filtering effect of transmitter, channel and receiver, symbols are smeared .
Receiver Structure AWGN DETECT DEMODULATE & SAMPLE SAMPLE at t = T RECEIVED WAVEFORM FREQUENCY DOWN CONVERSION RECEIVING FILTER EQUALIZING FILTER THRESHOLD COMPARISON MESSAGE SYMBOL OR CHANNEL SYMBOL TRANSMITTED WAVEFORM COMPENSATION FOR CHANNEL INDUCED ISI FOR BANDPASS SIGNALS OPTIONAL ESSENTIAL Demodulation/Detection of digital signals
Receiver Structure (contd) The digital receiver performs two basic functions: Demodulation Detection Why demodulate a baseband signal??? Channel and the transmitter s filter causes ISI which smears the transmitted pulses Required to recover a waveform to be sampled at t = nT. Detection decision-making process of selecting possible digital symbol
Important Observation Detection process for bandpass signals is similar to that of baseband signals. WHY??? Received signal for bandpass signals is converted to baseband before detecting Bandpass signals are heterodyned to baseband signals Heterodyning refers to the process of frequency conversion or mixing that yields a spectral shift in frequency. For linear system mathematics for detection remains same even with the shift in frequency
Steps in designing the receiver Find optimum solution for receiver design with the following goals: 1. Maximize SNR 2. Minimize ISI Steps in design: Model the received signal Find separate solutions for each of the goals.
Detection of Binary Signal in Gaussian Noise The recovery of signal at the receiver consist of two parts Filter Reduces the received signal to a single variable z(T) z(T) is called the test statistics Detector (or decision circuit) Compares the z(T) to some threshold level 0 , i.e., 1 H where H1 and H0 are the two possible binary hypothesis ( ) z T 0 0 H
Receiver Functionality The recovery of signal at the receiver consist of two parts: Waveform-to-sample transformation Demodulator followed by a sampler At the end of each symbol duration T, pre-detection point yields a sample z(T), called test statistic Where ai(T) is the desired signal component, and no(T) is the noise component Detection of symbol Assume that input noise is a Gaussian random process and receiving filter is linear = 0 exp 2 1. = + 2 , 1 = i ( ) ( ) ( ) z T a t n t 0 i 2. 2 1 1 n 0 ( ) p n 2 0 0
Finding optimized filter for AWGN channel Assuming Channel with response equal to impulse function
Detection of Binary Signal in Gaussian Noise For any binary channel, the transmitted signal over a symbol interval (0,T) is: = 0 ) ( 1 t s ( ) 0 0 s t t T for a binary 0 ( ) si t 1 t T for a binary The received signal r(t) degraded by noise n(t) and possibly degraded by the impulse response of the channel hc(t), is Where n(t) is assumed to be zero mean AWGN process For ideal distortionless channel where hc(t) is an impulse function and convolution with hc(t) produces no degradation, r(t) can be represented as: t n t s t r i + = ) ( ) ( ) ( = + 2 , 1 = ( ) ( ) * ( ) ( ) r t s t h t n t i i c = 2 , 1 0 i t T
Design the receiver filter to maximize the SNR Model the received signal = + ( ) ( ) ( ) ( ) r t s t h t n t (t ) si (t ) r (t ) hc i c (t ) n AWGN Simplify the model: Received signal in AWGN = + ( ) ( ) ( ) r t s t n t (t ) r (t ) si i Ideal channels = ( ) ( ) hc t t (t ) n AWGN
Find Filter Transfer Function H0(f) Objective: To maximizes (S/N)T and find h(t) Expressing signal ai(t) at filter output in terms of filter transfer function H(f) f H t a i e 2 = j ft ( ) ( ) ( ) S f df where H(f) is the filter transfer funtion and S(f) is the Fourier transform of input signal s(t) If the two sided PSD of i/p noise is N0/2 Output noise power can be expressed as: N 2 = 2 0 2 0 | ( | ) H f df Expressing (S/N)T : 2 2 j fT ( ) ( ) H f S f e df S = N 2 N 2 | ( | ) H f df 0 T
For H(f) = Hopt (f) to maximize (S/N)T use Schwarzs Inequality: 2 ) ( ) ( 2 2 ( ) ( ) f x f x dx f x dx f x dx 1 2 1 2 Equality holds if f1(x) = k f*2(x) where k is arbitrary constant and * indicates complex conjugate Associate H(f) with f1(x) and S(f) ej2 fT with f2(x) to get: 2 2 2 2 j fT ( ) ( ) ( ) ( ) H f S f e df H f df S f df Substitute yields to: 2 S 2 ( ) S f df N N 0 T
2 S E Or and energy E of the input signal s(t): 0 N df f S E ) ( max N 2 T = Thus (S/N)T depends on input signal energy and power spectral density of noise and NOT on the particular shape of the waveform 2 N S E Equality for transfer function H0(f) such that: max T holds for optimum filter N 0 f 2 2 = = j fT ( ) ( ) * ( ) H f H f kS f e 0 = 1 j fT ( ) * ( ) h t kS e For real valued s(t): ( ) 0 kS 0 T t t T ( = ) h t else where
MATCHED FILTER The impulse response of a filter producing maximum output signal-to-noise ratio is the mirror image of message signal s(t), delayed by symbol time duration T. The filter designed is called a MATCHED FILTER ( ) 0 kS 0 T t t T = ( ) h t else where Defined as: a linear filter designed to provide the maximum signal-to-noise power ratio at its output for a given transmitted symbol waveform
Replacing Matched filter with Integrator
Correlation realization of Matched filter A filter that is matched to the waveform s(t), has an impulse response = t h 0 ( ) 0 kS T t t T ( ) else where h(t) is a delayed version of the mirror image (rotated on the t = 0 axis) of the original signal waveform Impulse response of matched filter Mirror image of signal waveform Signal Waveform
Correlator Receiver This is a causal system a system is causal if before an excitation is applied at time t = T, the response is zero for - < t < T The signal waveform at the output of the matched filter is Substituting h(t) to yield: t = = ( ( ) ( ) * ( ) ) ( ) z t r t h t r h t d 0 t = ( ( ) ) ( ) z t r s T t d 0 d t = ( + ) r s T t 0 When t=T So the product integration of rxd signal with replica of transmitted waveform s(t) over one symbol interval is called Correlation T = ( ( ( ) ) ) z t r s d 0
Correlator versus Matched Filter The functions of the correlator and matched filter The mathematical operation of Correlator is correlation, where a signal is correlated with its replica Whereas the operation of Matched filter is Convolution, where signal is convolved with filter impulse response But the o/p of both is same at t=T so the functions of correlator and matched filter is same. Correlator Matched Filter
Implementation of matched filter receiver Bank of M matched filters ( ) 1T z * z ( ) s T t 1 1 Matched filter output: Observation vector (t ) r z = z ) Mz * ( ) sM T t (T zM = = ,..., 1 ( ) ( ) i M z r t s T t i i = = z ( ( ), ( ),..., ( )) ( , ,..., ) z T z T z T z z z 1 2 1 2 M M
Implementation of correlator receiver Bank of M correlators s ( ) 1 t ( ) 1T z T z Correlators output: Observation vector 1 0 (t ) r z = z (t ) s M ) Mz T (T zM 0 = = z ( ( ), ( ),..., ( )) ( , ,..., ) z T z T z T z z z 1 2 1 2 M M T 0 = = ( ) ( ) ,..., 1 z r t s t dt i M i i
Example of implementation of matched filter receivers ( ) 1t s Bank of 2 matched filters A T ( ) 1T z A 0 T t z T 1 (t ) r z = z 0 T ( ) s 2t ) z 2 T 0 ( z 2T 0 T t A A T T


")


")
 = Hopt (f) to maximize (S/N)T use Schwarz’s")