Optimize Power BI Training for Financial Data Management
Explore a comprehensive guide on setting up your computer for Power BI training, understanding financial data management using Power BI, practical exercises, and customizing reports for efficient decision-making. Get hands-on with Carnegie Mellon University's data warehouse through detailed instructions and insights provided in the training material.

Uploaded on | 1 Views
Download Presentation

Please find below an Image/Link to download the presentation.
The content on the website is provided AS IS for your information and personal use only. It may not be sold, licensed, or shared on other websites without obtaining consent from the author. If you encounter any issues during the download, it is possible that the publisher has removed the file from their server.
You are allowed to download the files provided on this website for personal or commercial use, subject to the condition that they are used lawfully. All files are the property of their respective owners.
The content on the website is provided AS IS for your information and personal use only. It may not be sold, licensed, or shared on other websites without obtaining consent from the author.
E N D
Presentation Transcript
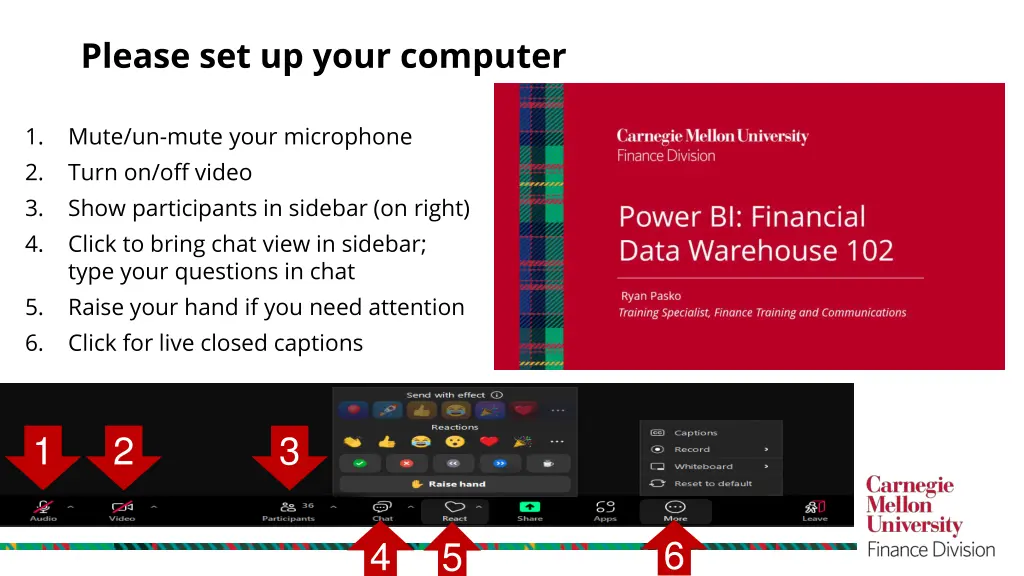
Please set up your computer 1. 2. 3. 4. Mute/un-mute your microphone Turn on/off video Show participants in sidebar (on right) Click to bring chat view in sidebar; type your questions in chat Raise your hand if you need attention Click for live closed captions 5. 6. 1 2 3 6 4 5
Power BI: Financial Data Warehouse 102 Ryan Pasko Training Specialist, Finance Training and Communications
LETS AGREE TO Be positive and in the present Be open to different ways of thinking Put phones away and on vibrate Take urgent calls on mute Welcome everyone into the discussion 3
AGENDA Welcome and Introductions Edit Mode Filters, Visualizations, and Data panels Adding, Deleting, and Moving Columns Formatting Visualizations Creating New Visualizations Drill Through Creating Dashboards Reminders 4
POWER BI OVERVIEW Power BI is used to access Carnegie Mellon University s financial data warehouse Comprehensive data management system designed to enable you to quickly review information and to effectively use it to support sound business decisions A storage and information processing site that gathers, sorts and stores existing data. Data is pulled from the Oracle Financials System nightly at 12:00am. Users can only see the data they have access to in Oracle. Allows for more flexibility in reporting, as reports can be customized. Does not contain new data and cannot be updated by users. Allows users to view and save the desired data only. 5
HANDS ON EXERCISES Please see your training manual for instructions for the hands-on training exercises https://app.powerbi.com/home Enter your CMU Andrew email address 6
EXERCISE #1 Your supervisor has asked you to update the GL Transaction Detail report to include the Fiscal Year, Invoice Source, and Vendor Type. You will also need to remove several fields to make the report more compact and less redundant. To accomplish this, we will edit and run the (name) GL Transaction Detail report to add, remove, and adjust several fields Add: Fiscal Year, Invoice Source, Vendor Type Remove: Period Name, Period Number, Tracking Number, Justification, and Merchant Name 7
EXERCISE #2 (ON YOUR OWN) You have decided to refine the GL Transaction Detail report further. You want to remove the Set of Books and Transaction Currency fields from the visual but you still want to filter by those fields. You don t want to see the duplicated values in the columns. Add the Minority Business field only to the filters Edit the GL Transaction Detail (Macro) report. Review/change the appropriate fields as necessary. When finished, save report and return to reading view 8
EXERCISE #3 Modify the AP Invoice Detail Report to narrow down the results to only show expense reports (ER) (not PRC reports) for employee Alexis A McCunein Organization (210100) for October 2011. Create a second page that will have a pie chart, slicer, and multi-row card to show the expense report information for the Organization 210100. We will look for Alexis A McCune in the results. Add Vendor Name and Func Curr Inv Line Amt to the Pie Chart Add APInvoice Number, Organization Number, Posted Flag, Set of Books to filters Add a Slicer to the page, and use the Accounting Date field for the Slicer Add a Multi-Row Card to the Page, use Vendor Name and Func Curr Inv Line Amt. 9
EXERCISE #4 Your manager has asked if the report can be built where if the pie chart is clicked it will direct you to the table of data for that one particular slice of the chart. We have decided to modify the AP Invoice Detail Report to drill through from the Pie Chart to the Table to show the records for each person (vendor name) when the Pie Chart is right clicked. 10
EXERCISE #5 Create a new Dashboard in the FDW 102 Workspace. Label it with your name. Pin the AP Invoice Detail Chart page and the GL Transactions Detail Page to the dashboard. 11
RESOURCES CMU Resources: GL Period Number and Name Table (PDF) https://www.cmu.edu/finance/systems/documentation/files/dw-period-numbers.pdf Data Warehouse Excel Macros https://www.cmu.edu/finance/systems/systems-services/macros.html PBIX File Download/Upload Tutorial https://drive.google.com/file/d/1snPmZmus0yNjX3DfHVfc6sWR1otukJYA/view Power BI Financial Data Warehouse 101 Training Page https://www.cmu.edu/finance/training/catalog/instructor/fdw/index.html Power BI FAQs https://www.cmu.edu/finance/systems/faq/power-bi.html External Power BI Resources: Microsoft: Power BI community LinkedIn Learning: Power BI Courses UT System Dashboard (Power BI Examples)
POWER BI USER GROUP Quarterly meetings with peers to discuss, share, and ask questions If interested email it-help@Andrew.cmu.edu
THANK YOU Power BI Questions? Contact the IT Help Desk It-help@andrew.cmu.edu Look for a follow up Email Link to our course survey


")