Optimizing Business Decision-Making through Analytics and Data Interpretation
Explore the world of business analytics and decision-making, from collecting and analyzing data to utilizing artificial intelligence and machine learning. Discover how data science and big data play crucial roles in transforming raw data into valuable insights for management decision-making.

Download Presentation

Please find below an Image/Link to download the presentation.
The content on the website is provided AS IS for your information and personal use only. It may not be sold, licensed, or shared on other websites without obtaining consent from the author. If you encounter any issues during the download, it is possible that the publisher has removed the file from their server.
You are allowed to download the files provided on this website for personal or commercial use, subject to the condition that they are used lawfully. All files are the property of their respective owners.
The content on the website is provided AS IS for your information and personal use only. It may not be sold, licensed, or shared on other websites without obtaining consent from the author.
E N D
Presentation Transcript
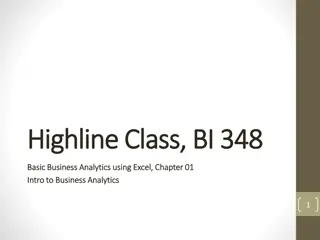
Business Analytics (Introduction) Understanding how to collect, transform, analyze, and interpret data to assist in management decision- making Business Analytics (Introduction) Wayne Smith, Ph.D. Department of Management CSU Northridge 1
Management Decision-making (from a Quantitative perspective) Artificial Intelligence ( Machine Learning , Algorithms ) Business Research ( Statistics , Hypothesis Testing ) Big Data (generally, linked data in the cloud ) Data Science ( using reproducible tools for visualization/analysis ) Business Analytics ( simpler approaches, augments decisions ) Our task (at least from a technology perspective) is to Capture, transform, analyze, and report data, and In reporting, to be quite technical, copy-paste-adjust (for the audience) 2
Information Dynamics Wisdom Extraordinary Insight (Explanation) for Foresight (Prediction) Restaurant: How should our menu change in the future to best optimize nightly sales? Knowledge Combination of Explicit Information and Tacit Information Restaurant: What action led to the change in last night s sales? Information Meaningful Data Restaurant: How does last night s sales compare to that night the previous year? How does last night s sales compare to our goals? Data Raw, atomic, basic Restaurant: What were the total sales for last night? 3
Analytics for Business Decision- making Prescriptive Analytics What should we do? HR Department: What should we (the HR Department) do to meet or exceed the organization s hiring and retention goals for next year? What data/information/knowledge/wisdom should we provide to our hiring and technical managers to help? What are we missing? Predictive Analytics What is likely to happen? HR Department: How many new employees will our organization need next year? How will the mix change? What is our competition likely to do? Diagnostic Analytics Why did it happen? HR Department: Did our emphasis on recruiting from campus A (over campus B, etc.) matter? What do the managers of these entry-level employees think? Descriptive Analytics What happened? HR Department: How many entry-level professionals did we hire last year? How many of them are still with us now? 5
Excels Add-ins Type of Analytics Prescriptive Predictive Add-in Solver Data Analysis Feature Linear Programming Correlation, Regression, Moving Average, Exponential Smoothing Z-test, t-test, F-text, Anova, Random Number Generation, Sampling Rank and Percentile, Histogram, Covariance Diagnostic Data Analysis Descriptive Data Analysis (Enable) Select File | More | Options |Add-ins | Go (it s near the bottom) Check both the Analysis Toolkit box and the Solver add-in box (Use) Select Data (and look to the right of the top part of the screen) Click on Analysis or Solver as desired 6
Analytics Dimensions Volume What is the scale of the data? Variety What are the different forms of data? Velocity What is the speed of change of the data? How does it stream? Veracity What is the level of uncertainty of the data? Examples 7
Communicating Data in Context Remember, at an atomic level, each data is a number, and that number has a specific meaning In general, the five basic communication contexts about a number in business are Change, Comparative, Goal, Ideal, or Stakeholder For example, in reading or writing sales volume and percentages, the context needs to be very clear. E.g., Sales volume increased 4% last quarter; this was a positive improvement. E.g., Sales volume increased 4% last quarter; but our competition did better. E.g., Sales volume increased 4% last quarter; however, our goal was 6%. E.g., Sales volume increased 4% last quarter; ideally, we can continue this. E.g., Sales volume increased 4% last quarter as we mentioned to our investors. You may need to do due diligence to express (when writing or speaking) or learn (when reading or listening) the context each number, or data. 8
Sources Some parts of this presentation were excerpted and adapted from: Charles, V., et .al (December, 2022) Why Data Analytics is an Art. Significance (Royal Statistical Society) (volume 9, issue 16, pp. 42-45) 11