Optimizing Business Processes with Kinetik Home Screen Simulation and Visualization Tools
Unlock the power of Kinetik Home Screen for General Managers to forecast, run simulations, analyze data, upload files, and optimize business models. Discover insights, calibrate detailed assumptions, and streamline go-to-market strategies using advanced visualization and analysis tools. Improve decision-making with the help of AI-driven tranches and route-path statistics. Dive into the world of prospecting, qualification, demos, meetings, negotiations, and more with the go-to-market system visualization. Enhance user experience design with UX insights and toggle between key views for better business and marketing performance tracking.

Download Presentation

Please find below an Image/Link to download the presentation.
The content on the website is provided AS IS for your information and personal use only. It may not be sold, licensed, or shared on other websites without obtaining consent from the author. If you encounter any issues during the download, it is possible that the publisher has removed the file from their server.
You are allowed to download the files provided on this website for personal or commercial use, subject to the condition that they are used lawfully. All files are the property of their respective owners.
The content on the website is provided AS IS for your information and personal use only. It may not be sold, licensed, or shared on other websites without obtaining consent from the author.
E N D
Presentation Transcript
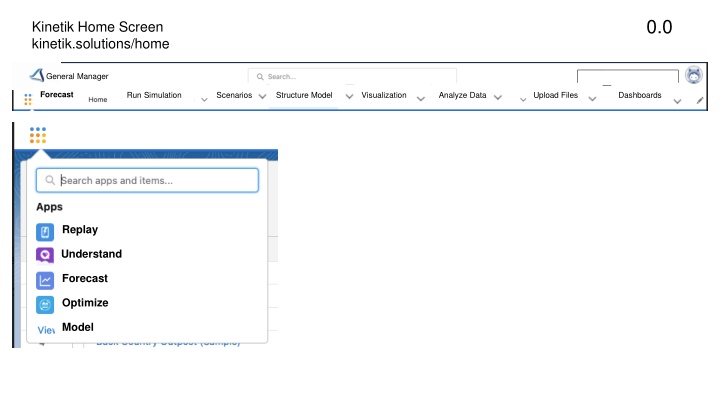
0.0 Kinetik Home Screen kinetik.solutions/home General Manager Forecast Run Simulation Scenarios Structure Model Visualization Analyze Data Upload Files Dashboards Replay Understand Forecast Optimize Model
0.0 Kinetik Home Screen kinetik.solutions/home General Manager Forecast Run Simulation Scenarios Structure Model Visualization Analyze Data Upload Files Dashboards Run Structure Model Scenarios Discovery Analyze Data Upload Files Dashboards Simulation Slider UX Resource levels and mix 20 minute survey Visualize system dynamics Calculate velocity statistics Upload CSV General Manager Load top 5 scenarios Simple upload: two files with dates Visual g2m builder Chief Revenue Officer Calculate current course and speed statistics Replay historical performance Productivity Drivers Sales Upload files and refine (min 2) Update key variables Multiple file upload: upload from box file or drive; infer dates or tag Constraining factor analysis Sales Operations Journey statistics for user defined tranches Operational Outcomes Calibrate Model Detailed Assumptions Marketing Profile user defined tranches Connect CRM Pipeline State and key metrics Channels Route path statistics for user defined tranches Strategy Tranches and Velocity Statistics AI proposed tranches and route-path statistics ($1M)
4.1 Go-to market System Visualization Prospecting Qualification Demo / Meeting Stall | Lost | Progress Proposal Stall | Lost | Progress Negotiation Stall | Lost | Progress Won Lead Streams 30% 5 4 3 2 1 0 Account Rep 30% | 30% | 40% 120 Opps 30% | 30% | 40% 120 Opps 3/10 Cascading icons new / total Speed = leads / week 30% 20% | 50% | 30% 60 Opps 20% | 50% | 30% 60 Opps Brand Rep Color code = tactic 3 / 10 new / total Conversion to opp visualized to OI source > notification 20% Business Partner 60% | 30% | 10% 20 Opps 60% | 30% | 10% 20 Opps 1 / 5 new / total 0% 25% | 15% | 60% 18 Opps 25% | 15% | 60% 18 Opps Specialist 0 / 9 40% | 30% | 30% 25 Opps 40% | 30% | 30% 25 Opps 66% Other new / total 1,000 100 10 2 /3 Contacts Now Leads new / total Opportunities Wk Mon Qtr Yr
UX Design 2 Toggle view: Business or marketing Default: weekly Campaign Performance 7.5 Simulation / History Control Panel Quarters CQ, NQ, All Timelin e: Portfoli o: Produc ts Sales, Mkt, BPs E/Q/D Progression Leads > Opportunitie s Cost / Lead Login Define profile Switch profile Detailed Scenario Analysis OI Source: S&D, Industry, Brand, Consulting Seller Community 19 Markets Mark et Lead Quality Scenario Analysis + + t0 t52 t- CC& S Win Rate of Mkt Leads Prog Velocity for Mkt Opps Cost / Win 52 Expand buttons to develop more detailed Leads CC& S Scoreboar d X X X X X X + Select: Meekly, Weekly, Quarterly, Toggle: Bottom 15 tactics $XX.X M $XX.X M $XX.X M Win s Los s DN P Tactic Performance (Top 15 tactics) Lead Creation Leads to Opportunities CC& S scenarios + Bubble Chart: new opportunities / new leads Bubble size = opportunity Color code mkt create, mkt influence, Hover: campaign, tactic, Marketing Mix CC& S + Incremental Resource CC& S Progression + TBD 5 Show time series view; Select: Meekly, Weekly, Quarterly,
Default: quarterly New Opportunities Simulation / History Control Panel Quarters 7.3 CQ, NQ, All Timelin e: Portfoli o: Produc ts Sales, Mkt, BPs Lead Gen Leads > Engage Engage > Qualify OI Source: Sales, Mkt, BPs Seller Community Progressio n Mark et Scenario Analysis + + t0 t52 t- CC& S Design > Propose Qualify > Design Propose > Negotiate 52 Expand buttons to develop more detailed New Opportunities CC& S Scoreboar d X X X X X X + Select: Meekly, Weekly, Quarterly, Closin g $XX.X M $XX.X M $XX.X M Win s Los s DN P Top 20 opportunities forecasted to close Bubble Chart: Win odds / fcst dec date Bubble size = opportunity Color code FLM Judgement Hover: FLM, Seller Odds, Dec Date; Request text update Qualify Velocity scenarios Lead Creation CC& S + Closing Velocity CC& S + Win Rate Progression CC& S + Seller Productivity 6 Show time series view; Select: Meekly, Weekly, Quarterly,
Strategy > Discovery UX Design 4 7.7 Digital Experience Scenario definition panel Update labels Update labels Update labels Win Rate + t0 t52 t- Color code based on quintile benchmarks Color code based on quintile benchmarks 7 52
Pipeline health > tranche definition Default: quarterly Control Panel Quarters 4.5 UX Design 5 CQ, NQ, All Timelin e: Portfoli o: Produc ts Sales, Mkt, BPs OI Source: C D Sales, Mkt, BPs Seller Community Mark et B E A F Scenario Analysis + CC& S Expand buttons to develop more detailed Pipeline Distribution New Opportunities CC& S + G Progression Velocity D Lead Creation scenarios CC& S + E Closing Velocity B A F CC& S + C Win Rate + CC& S + t0 t52 t- Progression TBD 8 52
Strategy > Forecasting Default: quarterly Simulatio n 7.7.1 UX Design 6 Control Panel Years Portfoli o: Geograph y: Lead Sources: Opportunity Owners Lead Passing Quarter, Year, Three Forecast Horizon: Select Products Select Geographies Select all that apply Select all that apply From to - rules Select number and type By resource and tactic Where are leads coming from? Assumptions vs Actuals vs. benchmarks Resourc es Productivi ty Over / Under Seller Capacity required Top 5 risk areas Scenario Analysis + + t0 t156 t-0 CC& S Expand buttons to develop more detailed New Opportunities CC& S + Scoreboar d Progression Velocity scenarios Show range of outcomes; choose variables with greatest impact CC& S + $XX.X M Closing Velocity $XX.X M $XX.X M $XX.X M CC& S + Win Rate CC& S + Q 3 Q 1Show time series view; Select: Weekly, Quarterly, Annually 2 Q Q 4 TBD
4.3 Pipeline Insights 1 visualization 2 3 Pipeline analysis and Analyze where gaps exist Identify root cause issues need more leads VL > QL progression Equation Variables (metrics) Drive rs Aligned to Client Priorities/Needs Growth Segments / Top Accounts Competitive Offering / Portfolio Competitive Price Compelling Offerings / Value Proposition Win Rate Awareness / Preference Marketing Leads Signin Healthy Lead Stream S&D Alignment gs Growth Alliances Early Stage Business Development Seller Coverage Strong Lead Progression Delivery Capacit y / Utilizati on # of days to close Seller Productivity Seller Skills 4 5 6 Determine tactics to address Frame tactics and size impact Drive account team execution To: From: General Manager RE: Pipeline > New Event IOT Leaders Reach 100 Response 30 Leads 10 Pipeline $30M UX Design Challenge: What is main screen? How does navigation work? What does the overall architecture look like and how do we document and update? Standard screens for let s run an event! create an account; change password etc. Microsoft CRM version. Salesforce version. Can we copy look and feel and navigation directly from Salesforce? 10
Default: quarterly Control Panel Years Portfoli o: Geograph y: Lead Sources: Opportunity Owners Lead Passing OI Diagnostics UX Design 7 Quarter, Year, Three Forecast Horizon: Select Products Select Geographies Select all that apply Select all that apply From to - rules Select number and type By resource and tactic Resourc es Productivi ty Scenario Analysis + CC& S Expand buttons to develop more detailed New Opportunities CC& S + Progression Velocity scenarios CC& S + Closing Velocity CC& S + Win Rate + CC& S t0 t52 t- + 52 TBD 11
UX Design 8 Default: quarterly Control Panel Years Portfoli o: Geograph y: Lead Sources: Opportunity Owners Lead Passing Quarter, Year, Three Forecast Horizon: Select Products Select Geographies Select all that apply Select all that apply From to - rules Select number and type By resource and tactic Resourc es Productivi ty Scenario Analysis + CC& S Expand buttons to develop more detailed New Opportunities CC& S + Progression Velocity scenarios CC& S + Closing Velocity CC& S + Win Rate CC& S + TBD 12
UX Design 9 Analyst Structure model Upload file [cleanse data with anonomizer] Calibrate model with actual results Regression of forecast vs actuals for training periods Resources / Actions / Outcomes input screens and review Load Targets. Target vs actual settings Define Traunches. Auto-calculate traunches Define executive settings Upload sales plans and coverage model Upload marketing campaign and tactic history Upload business partner profiles and history Review traunche definition and profiles 13
Customer Journey Describe objectives Define scope of model Accuracy parameters Choose your adventure tbd tbd 1DIY Version 2 3Kinetik Labs Kinetik Assist Single product, single geography, <5 OI sources, <5 OO channels Enterprise Analyst (EA) or consultant uploads files or downloads python scripts to calculate offline EA runs and calculates new opportunities statistics and Velocity Statistics (VS) EA uploads current pipeline and VS to secure instance on the cloud EA validates forecast vs actuals and manually adjusts VS and new opportunities No Cluster analysis No Traunche Definition tbd tbd 14 14
Tranche hypotheses Profile variables Definition Deal size FLM Call Days since opened Days in Sales Stage OI Source Business Unit / Product Sales Stage at Entry Geographic Market New leads. / week Progression by sales stage Win Rate 15
Narrative How? Why? What? Dreamforce Conference. Keynote speaker. Sharing personal story about an organizational turnaround that started in 2023. Website Build on enterprises massive investment in CRM systems; improvement in workflow but not predictive capability or insights Clickable demo; freemium version with self-service model creation Underestimated complexity in understanding interdependencies across route-to-market systems (IBM Marketing 35 FTEs creating 100 page presentations every week) Team was stuck for a long time. Functions were pointing fingers at each other. Core team (1 data science, 1 CRM expert, 1 UX designer, 1 statistics modeler) Frustration. Lack of success is energy draining. High turnover. Multi-billion dollar problem. Impact of 2% incremental growth on market capitalization at IBM ( Adopted a Moneyball approach. Next generation statistics with advanced simulation to align the team and agree on the right set of actions and milestones. $250K proof of concept project Disaggregate pipeline of sales opportunities and profile progression patterns for clusters with same combination of attributes Enabled bold action. Everyone bought in. Execution accelerated and won championship. Instead of cutting jobs to maintain profit we returned to Job growth. Return to innovation and growth for large enterprises. Continuously learning application based on weekly pipeline updates Monte Carlo simulation powered by by historical pipeline statistics 16
Narrative > Why Dreamforce Conference. Keynote speaker. Sharing personal story about an organizational turnaround that started in 2023. Team was stuck for a long time. Functions were pointing fingers at each other. Frustration. Lack of success is energy draining. High turnover. Business was stagnant and kept being challenged with resource reductions. Adopted a Moneyball approach. Next generation statistics with advanced simulation to align the team and agree on the right set of actions and milestones. Enabled bold action. Everyone bought in. Execution accelerated and the momentum from the early changes we made drove enabled . Industry is being disrupted. Competitors are moving quickly. Eaten from below. Advantages of being a market share leader are outweighed by complexity of the organization. Wins championship. Everyone wants to be successful. Job growth. Return to innovation and growth for large enterprises. 17 Microsoft. Ballmer vs. Nadalla.
Industries Manufacturing Media Agriculture Entertainment Not For Profit Apparel Environmental Other Banking Finance Recreation Biotechnology Food & Beverage Chemicals Retail Government Communications Shipping Healthcare Construction Technology Hospitality Consulting Telecommunications Insurance Education Transportation Electronics Machinery Utilities Energy Engineering


