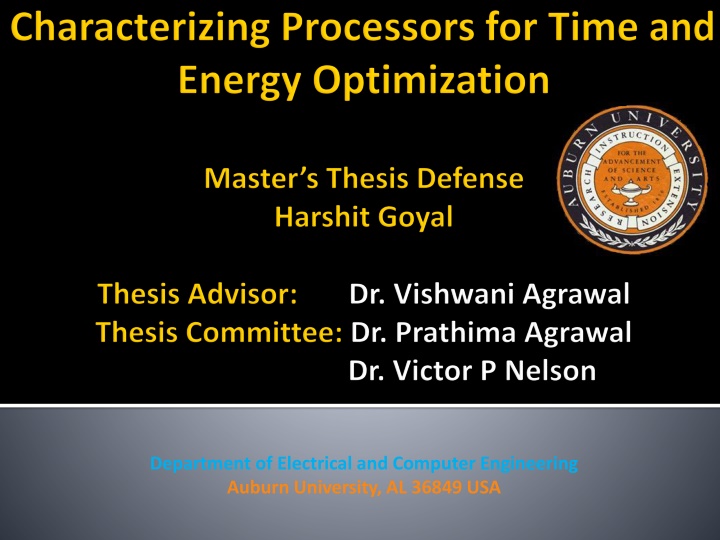
Optimizing Processor Performance Through Energy Efficiency
Microprocessors and single-chip computers play a vital role in the digital world. As transistor speed scaling diminishes, energy efficiency becomes a key factor for performance. This research focuses on co-optimizing performance, power, and area to meet industry demands. It delves into obtaining data on processor voltage, frequency, and cycle efficiency for optimal time and energy operations, addressing power dissipation sources such as dynamic, short circuit, and static/leakage dissipation. The study aims to enhance performance through energy optimization strategies

Download Presentation

Please find below an Image/Link to download the presentation.
The content on the website is provided AS IS for your information and personal use only. It may not be sold, licensed, or shared on other websites without obtaining consent from the author.If you encounter any issues during the download, it is possible that the publisher has removed the file from their server.
You are allowed to download the files provided on this website for personal or commercial use, subject to the condition that they are used lawfully. All files are the property of their respective owners.
The content on the website is provided AS IS for your information and personal use only. It may not be sold, licensed, or shared on other websites without obtaining consent from the author.
E N D
Presentation Transcript
Department of Electrical and Computer Engineering Auburn University, AL 36849 USA
Prof. Vishwani Agrawal and Prof. Prathima Agrawal for their invaluable guidance throughout my work, Prof. Victor P Nelson for being my committee member and for his courses that helped me understand various tools, All staff members of EE department, My friends and family for their support throughout my research. July 18, 2016 2
Introduction Problem Statement Background Methodology Simulation setup Results Applications Conclusion July 18, 2016 3
Microprocessorssingle-chip computersare the building blocks of the information world. In the next two decades, diminishing transistor-speed scaling and practical energy limits create new challenges for continued performance scaling. Energy efficiency is the new fundamental limiter of processor performance, way beyond numbers of processors. July 18, 2016 4
Performance Power Area Performance, Power and Area are three conflicting goals, and industry demands that all three aspects be co-optimized. To obtain a complete performance modelling requires marrying everything from high-level modelling and synthesis to better characterization and verification. July 18, 2016 5
Obtain data on voltage, frequency and cycle efficiency of the processor for time and energy optimization. Determine operating conditions (voltage and frequency) for optimal time energy operations. July 18, 2016 6
There are three main sources of power dissipation: Dynamic power dissipation Short circuit dissipation Static/Leakage dissipation July 18, 2016 8
Power = Energy/transition Transition rate Due to charging and discharging of capacitances. = CLVDD f0 1 = CLVDD2 f P0 1 (1) (2) = CswitchedVDD2 f (3) Power dissipation is data dependent depends on the switching probability Switched capacitance Cswitched = P0 1CL= CL ( is called the switching activity) 9
Short Circuit Power Occurs during signal transitions when both pullup and pulldown paths are partially conducting causing a direct path between Vdd and GND. Static Power This power dissipation occurs all the time through leakage even when the device is in standby mode and is given as: Pstatic= IstaticVdd July 18, 2016 10
What is Characterization? Characterization over Process, Voltage, Frequency, Power, Temperature Performance Metric Energy Efficiency Metric July 18, 2016 11
PDP(Power Delay Product)/Energy per Cycle PDP = Pavg x tp Energy Delay Product. Cycle Efficiency July 18, 2016 12
Clock Frequency MIPS MFLOPS Synthetic Benchmarks Performance per Watt July 18, 2016 13
1 Time performance = ????????? ???? 1 Energy Performance = ?????? ?????????? July 18, 2016 14
Time Performance of Processor. Speed of a processor is measured in cycles per second or clock frequency (f). Here a clock cycle means 1/f second in time Execution time of a program using C clock cycles = C/f Time performance = f/C Energy Performance of a Processor. Efficiency of a processor may be measured in cycles per joule or cycle efficiency ( ). Also, a clock cycle means 1/ joule in energy Energy dissipated by a program using C clock cycles = C/ Energy performance = /C So the power consumed can be given as, P = f/ (Product of Energy and Time) July 18, 2016 15
Technology Characterization Simulate a reasonable size adder circuit using selected vectors. Scale adder data to obtain processor power (cycle efficiency) and frequency at different operating points using scale factors. Develop power management scenarios using cycle efficiency and frequency. July 18, 2016 16
Questa Sim Design, compile and simulate designs Leonardo Spectrum ASIC and standard cell synthesis Design Architect-IC Schematic Capture HSPICE Circuit simulation and verification July 18, 2016 17
Adder circuit Fundamental block of functional units Often in processor s critical path Used 16-bit Ripple Carry Adder. PTM Models Characterized in two PTM models: bulk CMOS and High-K Technology node: 45nm, 32nm and 22nm July 18, 2016 18
1000 random vectors were generated using a MATLAB code Simulation in H-spice in 90nm Bulk CMOS PTM at 1.4 volts and frequency 1.45 GHz gives cycle avg. power per vector. 20 July 18, 2016
Out of 1000 random vectors 50 vector pair were selected such that: 16 consume avg. power 17 consume above avg. power including the peak power vector pair 17 consume below avg. power including the min. power vector pair July 18, 2016 21
Simulation Data from H-spice for 32nm Bulk CMOS PTM Model Voltage Power from simulation Timing from simulation Energy per cycle pavg. ( W) 124.03 100.5 81.93 66.21 53.77 42.65 33.4 19.08 9.59 3.97 1.138 0.229 0.1 0.047 0.025 0.014 0.0074 0.0002 pdyn ( W) 91.37 78.31 66.72 55.74 46.51 37.58 29.83 17.32 8.73 3.57 0.956 0.15 0.048 0.014 0.004 0.0009 pstatic ( W) 32.66 22.19 15.21 10.47 7.26 5.07 3.57 1.751 0.856 0.406 0.182 0.079 0.051 0.033 0.021 0.013 0.0072 0.0086 Ppeak ( W) 397.71 335.74 261.9 217.46 178.2 144.77 115.34 73.71 35.76 14.71 4.01 0.695 0.233 0.09 0.036 0.017 Critical path Delay (ps) 320.85 338.91 360.46 386.5 418.72 459.03 509.72 666.65 986.51 1792.1 4511.7 18928 44168 112760 279310 716150 1851700 fmax (GHz) 3.12 2.95 2.77 2.59 2.39 2.18 1.96 1.5 1.014 0.558 0.222 0.053 0.023 0.009 0.004 0.0014 0.0005 edyn (fJ) 29.32 26.54 24.05 21.54 19.47 17.25 15.21 11.55 8.62 6.39 4.31 2.84 2.13 1.601 1.056 0.645 0.3494 estatic (fJ) 10.48 7.52 5.48 4.05 3.04 2.33 1.8202 1.167 0.844 0.727 0.819 1.488 2.27 3.75 5.85 9.08 13.27 eavg. (fJ) 39.8 34.06 29.53 25.59 22.51 19.58 17.03 12.72 9.46 7.12 5.13 4.33 4.4 5.35 6.91 9.73 13.62 Vdd (v) 1.2 1.15 1.1 1.05 1 0.95 0.9 0.8 0.7 0.6 0.5 0.4 0.35 0.3 0.25 0.2 0.15 July 18, 2016 22
AVERAGE, PEAK, DYNAMIC AND STATIC POWER PDP/ENERGY PER CYCLE July 18, 2016 23
Intel i5 Sandy Bridge 2500K Specifications Technology Node 32nm Voltage Range 1.2 - 1.5 volts Nominal Base Frequency, ??? 3.3 GHz Overclock Frequency, ??? 5.01 GHz Thermal Design Power, TDP 95 Watts Peak Power 132 Watts July 18, 2016 24
TDP- is the average maximum power in watts the processor dissipates when operating at base frequency with all cores active under a manufacturer defined, high complexity workload. Peak power is the maximum power dissipated by the processor. July 18, 2016 25
All the scaling factors were found using processors specifications given at rated voltage 1.2v assuming that voltage was not raised for overclock frequency. Total power both circuits are given as: ? = (???? ????) + ????? ??? = (???? ????) + ????? Processor) Since we selected our vectors in specific way, therefore the activity produced in both the circuits is assumed to be same and hence the activity factor in this case is 1. Now, if is the scale factor representing the relative size of processor to adder circuit and is the voltage factor i.e. both the adder as well as processor are simulated at same supply voltage, then eq. 1 modifies eq. 2 as: ??? = ??[ ???? ???? + ?????] Solving for gives: ??? [ ???? ???? +?????]at rate voltage and frequency (1) (Total Power for Adder) (2) (Total Power for = July 18, 2016 27
Processor base frequency (????) describes the rate at which the processor's transistors open and close. The processor base frequency is the operating point where TDP is defined and is given as: ???? = ? ???? ????? Where, is a scale factor for ?nom and is given by, =??????? (?????????) ??????? (?????) (Frequencies at rated voltage =1.2 volts) In a structure constrained system, the frequency (????) is limited by the critical path delay of the circuit as follows: ????= ? ???? ????? Where, is a scale factor for ?max and is given by, ? =??????? (?????????) ??????? (?????) (3) (Frequencies at rated voltage =1.2 volts) July 18, 2016 28
In a power constrained system [10- 12], the frequency (fTDP) is limited by the maximum allowable power of the circuit. In general it can be represented as, ??? ??????? ?? ???? fTDP= (4) July 18, 2016 29
Scale Factors Calculated Values Voltage factor, 1 fnom, 1.0588 fmax, 1.6075 7.3414 105 Area factor, July 18, 2016 30
The energy per cycle for the processor for the nominal frequency and overclock/maximum frequency for a any given Vdd is defined by: ??????=??? ???? ???? ????+??????? (5) ????? = (fnom F0 fmax) (6) ?? Here in this case, F0 = fmax = 5.01 GHz, therefore we call EPCFo as EPCfmax As we know, cycle efficiency is given by =1/EPC , eq. 5 and 6 gives: ? ? ? = ?????? and, ??= (fnom F0 fmax) ????? Here, EPCFo = EPCfmax therefore we call 0 as peak cycle efficiency. July 18, 2016 31
Voltage Scaled Power Scaled Frequency Energy per cycle Cycle efficiency Pavg. (W) 95 77.16 63.03 51.01 41.48 32.93 25.81 14.75 7.42 3.07 0.877 0.174 0.075 0.038 0.035 0.018 0.0029 0.01 0.0054 0.0001 Pdyn (W) 71.02 60.87 51.86 43.33 36.15 29.21 23.19 13.47 6.79 2.77 0.743 0.117 Pstatic (W) 23.98 16.29 11.17 7.69 5.33 3.72 2.62 1.286 0.628 0.298 0.133 0.058 0.038 0.024 0.015 0.0093 0.0053 fmax (GHz) 5.01 4.74 4.46 4.16 3.84 3.5 3.15 2.41 1.629 0.897 0.356 0.085 0.036 0.014 0.0058 0.0022 0.0009 Efnom (nJ) 28.79 24.7 21.46 18.62 16.4 14.28 12.43 9.29 6.91 5.2 3.74 3.12 3.14 3.77 4.83 6.77 9.46 Efmax (nJ) 26.31 22.92 20.16 17.66 15.68 13.73 11.99 9.01 6.71 5.02 3.54 2.76 2.6 2.89 3.45 4.62 6.32 o Vdd (v) fnom (GHz) (106cycles/J) 34.74 40.49 46.6 53.7 60.96 70.04 80.48 107.66 144.71 192.43 267.7 321.02 318.66 265.04 206.93 147.71 105.74 (106cycles/J) 38.01 43.63 49.6 56.61 63.76 72.85 83.37 110.96 149.02 199.02 282.35 361.92 384.45 346.44 290.03 216.41 158.31 1.2 1.15 1.1 1.05 1 0.95 0.9 0.8 0.7 0.6 0.5 0.4 0.35 0.3 0.25 0.2 0.15 3.3 3.12 2.94 2.74 2.53 2.31 2.08 1.588 1.073 0.591 0.235 0.056 0.024 0.0094 0.0038 0.0015 0.0006 0.011 0.0007 July 18, 2016 32
Because our own greatest access and insight involves Intel designs and data, our graphs and estimates draw heavily on them. July 18, 2016 33
Plot showing proposed Power Management Method" for three different regions. July 18, 2016 35
Power dissipation depends on the time period used To maintain the same power dissipation, clock period can be reduced i.e. increasing frequency. To maximize the performance we find the highest frequency, fopt that would exceed neither the power constraint nor the critical path i.e. fopt= fmax= fTDP Using eq. 3 and 4, we measure fTDP and fmax for different supply voltages. July 18, 2016 36
Clock Frequencies (MHz) Cycle efficiency Voltage Vdd (Volts) Structure Constrained (fmax) 5486 5257 5010 4740 4531 4460 4160 3840 3500 3150 Power Constrained (fTDP) 2243 2761 3300 4040 4531 4750 5520 6270 7210 8280 Peak 0at fmax (106 cycles/J) 31.09 34.22 38.01 43.63 47.91 49.6 56.61 63.76 72.85 83.37 TDP at fTDP (106 cycles/J) 23.57 29.04 34.74 42.52 47.91 49.98 58.11 66.02 75.87 87.11 1.3 1.25 1.2 1.15 1.112 1.1 1.05 1 0.95 0.9 ??? ??????? ?? ???? fTDP= and ???? = ? ???? ????? July 18, 2016 37
Plotting and curve fitting these two functions for f and in Excel gives 4 polynomial equations: fmax= -168.35(Vdd)3- 2991.2(Vdd)2+ 13042(Vdd) - 6043 (7) fTDP= -9730.6(Vdd)3+ 45254(Vdd)2 78922(Vdd) + 49719 (8) 0= -66.649(Vdd)3+ 412.23(Vdd)2- 792.82(Vdd) + 511.39 (9) TDP= -100.33(Vdd)3+ 468.29(Vdd)2- 820.67(Vdd) + 519.25 (10) The highest power is 3 and is solvable using any Numerical solver such as MATLAB. Discarding 2 complex roots, the real root gives Vdd = 1.112 volts = Vddopt Substituting Vdd = Vddopt in eq. (7) or (8) gives fopt = 4531 MHz Substituting Vdd = Vddopt in eq. (9) or (10) gives opt = 47.91 106cycles/J. July 18, 2016 38
TIME AND ENERGY FOR A PROGRAM THAT EXECUTES IN c= 2 BILLION CLOCK CYCLES Cycle Efficiency (106cycles/J) Power Execution Time (seconds) ? Total Energy (Joules) ? Clock Frequency f (MHz) Consumption (Watts) ? Operating Modes Voltage (volts) ? Nominal Operating Point 1.2 3300 34.74 95W 0.61 57.57 At 3300 (80% task) At 5010 (20% task) 34.74 95W Overclocked Operating Point 20% Ovrclk 0.485+0.0798 =0.57 46.06+10.52 = 56.58 1.2 38.01 132W Optimum Operating Point 0.44 (-28%) 41.75 (-28%) 1.112 4531 47.91 95W Dynamic Voltage scale point Energy Efficient point 41.77W (-56%) 0.61 (0%) 25.31 (-56%) 0.92 3300 79.01 0.35 36.39 384.45 0.0946 54.96 5.241
Nominal Operation Rated Specifications Optimized Performance Optimization Energy Optimization Intel PTM Models Processor used fTDP (MHz) Vdd (v) TDP (106 c/J) Vdd (v) TDP (106 c/J) Vddopt (v) fopt (MHz) opt (106 c/J) Vdd (v) f 0 0 (106c/J) (MHz) 45nm bulk Core 2 Duo T9500 2600 1.25 74.29 1.07 108.58 1.2 2920 82.28 0.35 33.51 829.29 45nm High-K Core 2 Duo T9500 2600 1.25 74.29 0.79 350.91 1.226 3120 89.08 0.3 304.48 1795 32nm bulk Core i5- 2500K 3300 1.2 34.74 0.92 79.01 1.112 4531 47.91 0.35 36.39 384.45 32nm High-K Core i5- 2500K 3300 1.2 34.74 0.67 267.57 1.155 4940 51.77 0.3 414.23 953.81 22nm bulk Core i7- 3820QM 2700 0.8 60 0.7 96.22 0.771 3494 75.46 0.38 177.25 213.99 22nm High-K Core i7- 3820QM 2700 0.8 60 0.61 137.65 0.76 3626 80.38 0.3 332.58 375.76 42
Present Work Simulation based evaluation. Power management is described through: Improving rated cycle efficiency Performance optimization Energy optimization Future Work Process variation can be taken in account Effect of noise margin in sub-threshold region Better evaluation of activity factor July 18, 2016 43
[1] Harshit Goyal and V. D. Agrawal, Characterizing Processors for Energy and Performance Management in Proc. 16th International Workshop on Microprocessor/SoC Test and Verification (MTV), Austin, Texas, Dec. 3-4, 2015 [2] Harshit Goyal and V. D. Agrawal, Characterizing Processors for Energy and Performance Management IEEE VLSI Test Symposium, Las vegas, CA, April 2016 (Poster) [3] D. A. Patterson and J. L. Hennessy, Computer Organization& Design, the Hardware/Software Interface. San Francisco, California: Morgan Kaufman, fourth edition, 2008. [4] Aditi shinde and V. D. Agrawal, Managing Performance and Efficiency of a Processor , in proc. 45th Southeastern Symp. System Theory, 2013. [5] K. Kim and V. D. Agrawal, Dual Voltage Design for Minimum Energy using Gate Slack, in Proc. International Conf. on Industrial Technology, 2011, pp. 419 424. [6] K. Kim and V. D. Agrawal, Minimum Energy CMOS Design with Dual Subthreshold Supply and Multiple Logic-Level Gates, in Proc. International Symp. Quality Electronic Design, 2011, pp. 689 694. [7]. Bienia, C. et. al. The PARSEC benchmark suite: Characterization and architectural implications. The 17th International Symposium on Parallel Architectures and Compilation Techniques (2008). [8]. Borkar, Shekhar, and Andrew A. Chien. "The future of microprocessors."Communications of the ACM 54.5 (2011): 67-77. July 18, 2016 44
[9] Wang, A; Chandrakasan, AP.; Kosonocky, S.V., "Optimal supply and threshold scaling for subthreshold CMOS circuits," VLSI, 2002. Proceedings. IEEE Computer Society Annual Symposium on , vol., no., pp.5,9, 2002 [10] Venkataramani, P. Reducing ATE Test Time by Voltage and Frequency Scaling. PhD thesis, Auburn University, Auburn, AL, May 2014. [11] Venkataramani, P., Sindia, S., and Agrawal, V. D. A Test Time Theorem and its Applications. Journal of Electronic Testing: Theory and Applications 30, 2 (2014), 229-236. [12] Venkataramani, P., and Agrawal, V. D. Reducing Test Time of Power Constrained Test by Optimal Selection of Supply Voltage. In Proc. 26th International Conf. VLSI Design (Jan. 2013), pp. 273-278. [13] Design Architect User Guide. Mentor Graphics Corp., Wilsonville, OR, 1991-1995. [14] HSPICE Signal Integrity User Guide. Synopsys, Inc., 700, East Middlefield Road, Mountain View, CA 94043, 2010. [15] Leonardo Spectrum User Guide. Mentor Graphics Corp., Wilsonville, OR, 2011. [16] Questa Sim User Guide. Mentor Graphics Corp., Wilsonville, OR, 2011. [17] Intel Core i5-2500K Processor (6M Cache, up to 3.70 GHz) Specifications, 2016. http://ark.intel.com/products/52210/Intel-Core-i5-2500K-Processor-6M-Cache- up-to-3 70-GHz. July 18, 2016 45
Thank You July 18, 2016 46


/Energy per Cycle")


 describes the rate at")


")