"Explore the concept of power capping via forced idleness in server racks, aiming to reduce mean response time and enhance performance efficiency through innovative techniques like IdleCap. Discover how IdleCap works, its impact on power consumption, and the advantages it offers over traditional power capping methods."
Please find below an Image/Link to download the presentation.
The content on the website is provided AS IS for your information and personal use only. It may not be sold, licensed, or shared on other websites without obtaining consent from the author. If you encounter any issues during the download, it is possible that the publisher has removed the file from their server.
You are allowed to download the files provided on this website for personal or commercial use, subject to the condition that they are used lawfully. All files are the property of their respective owners.
The content on the website is provided AS IS for your information and personal use only. It may not be sold, licensed, or shared on other websites without obtaining consent from the author.
E N D
Presentation Transcript
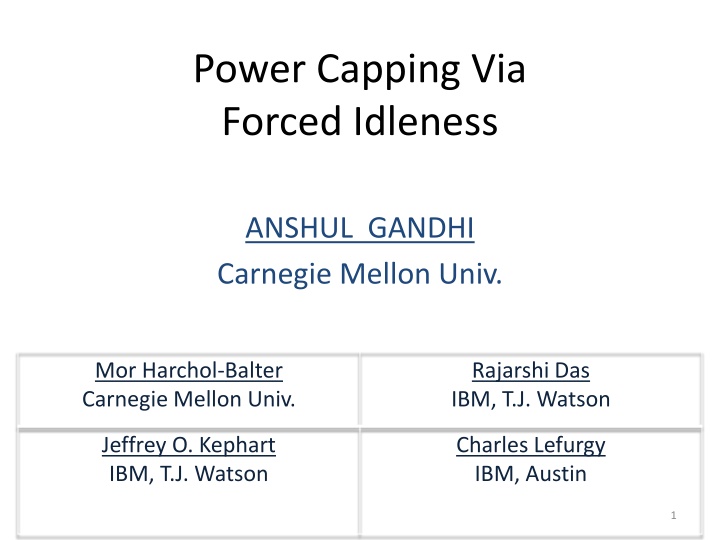
Power Capping Via Forced Idleness ANSHUL GANDHI Carnegie Mellon Univ. Mor Harchol-Balter Carnegie Mellon Univ. Rajarshi Das IBM, T.J. Watson Jeffrey O. Kephart IBM, T.J. Watson Charles Lefurgy IBM, Austin 1
Server Rack Power Consumption 30 kW 30 kW/racks 10 kW 20 2 kW 10 0 Industry Average (2005) Industry Worst-case (2005) High Density Racks (2008) Problems: (1) Power delivery constraints (2) Cooling requirements infeasible Source: APC White Paper #46, 2005 2
Power Capping Limits average power consumption of servers over a time interval to stay below specified threshold. Lefurgy, Wang and Ware; ICAC, 2007. Temperature ( F) Clock-throttling Power (watts) Wang and Chen; HPCA, 2008. Frequency (GHz) Use clock-throttling or DVFS to control power consumption. Use clock-throttling or DVFS to control temperature. 3
Effect on performance CPU bound DAXPY Memory bound STREAM Mean Response Time (secs) Mean Response Time (secs) 3X worse 7X worse Clock-throttling Clock-throttling Power cap (watts) Power cap (watts) Significant performance loss across workloads 4 Source: Our experimental results on an IBM Blade
Goal Dual Goal IdleCap Power Capping Reduce Mean Response Time IdleCap can reduce mean response time 2X-4X across workloads over existing power capping. (Results based on clock throttling) 5
How IdleCap works Existing power capping: Dithers between adjacent states. Power (watts) Clock-throttling IdleCap: Dithers between extreme states: C1E, 3 GHz. IdleCap C1E IdleCap achieves higher frequency for any power cap. Frequency (GHz) 6
Example: 170 Watts Clock throttling: 170 Watts 0.7 GHz Power (watts) Clock-throttling IdleCap: 170 Watts 1.5 GHz IdleCap Same power cap, twice the frequency. Frequency (GHz) = 1.5 GHz 7
Analysis Power Cap IdleCap r 170 W 1.5 GHz 1/2 Power (watts) 195 W 2.25 GHz 3/4 Clock-throttling IdleCap r: Fraction of time spent in 3 GHz state P P 1 cap C E Frequency (GHz) = r P P 1 max C E 8
Analysis Mean Response Time when running at 3 GHz [ ] E T Power Cap IdleCap r 0 170 W 1.5 GHz 1/2 195 W 2.25 GHz 3/4 Mean Response Time with IdleCap [ ] E T IdleCap [ ] E T 0 = [ ] E T r: Fraction of time spent in 3 GHz state IdleCap r P P 1 cap C E [ ] E T = r 0 P P Entirely Predictable 1 max C E 9
Experimental Setup IBM BladeCenter HS21 3GHz, quad core, 4GB RAM C1E idle state Workload CPU bound (LINPACK, DAXPY) Memory bound (STREAM) Alternation period: Time between successive entries to C1E state 1millisec, 10millisec, 100millisec, 1sec, 10sec 10
Results: DAXPY Mean Response Time (secs) Mean Response Time (secs) Clock-throttling E IdleCap ] = Clock-throttling [ ] T 0 [ E T IdleCap r IdleCap IdleCaptheory Alternation period (secs) Power cap (watts) Predicted E[T] = Observed E[T] Overheads due to alternations: 6% Alternation period: 1 second Up to 4X reduction in Mean response time. 11
Results: LINPACK Mean Response Time (secs) Mean Response Time (secs) Clock-throttling Clock-throttling IdleCap IdleCap IdleCaptheory Alternation period (secs) Power cap (watts) Predicted E[T] = Observed E[T] Overheads due to alternations: 15% Up to 3X reduction in Mean response time. 12
Results: STREAM Mean Response Time (secs) Mean Response Time (secs) Clock-throttling Clock-throttling IdleCap IdleCaptheory IdleCap Alternation period (secs) Power cap (watts) Predicted E[T] = Observed E[T] Overheads due to alternations: 10% Up to 2X reduction in Mean response time. 13
IdleCap and DVFS Power (watts) Problem: Concave upwards Concave downwards Future: DVFS C1E IdleCap C6 Frequency (GHz) Use advanced idle states (C6 on Intel). 14
IdleCap and DVFS Power (watts) Non-linear DVFS IdleCap C6 Frequency (GHz) IdleCap applies to lower frequency range. 15
Conclusions IdleCap is superior to existing power capping techniques based on clock throttling. Applies to various workloads under alternation periods as small as 1 millisecond. Response Time (secs) Response Time (secs) Response Time (secs) Mean Response Time (secs) Mean Response Time (secs) STREAM DAXPY LINPACK Power cap (watts) Power cap (watts) Power cap (watts) Mean Response Time (secs) Mean Response Time (secs) Mean Response Time (secs) Response Time (secs) Response Time (secs) Response Time (secs) DAXPY LINPACK STREAM 16 Alternation period (secs) Alternation period (secs) Alternation period (secs)