Optimizing Wine Cellar Metrics
Dive into the world of wine cellar metrics with Gary M. Thompson, Ph.D., as he introduces a comprehensive evaluation framework for managing and optimizing wine cellars. Explore the importance of diversity, concentration, and price considerations in maintaining a stable and robust cellar. Learn how these metrics can help cellar owners make informed decisions and enhance their wine-drinking experience.

Download Presentation

Please find below an Image/Link to download the presentation.
The content on the website is provided AS IS for your information and personal use only. It may not be sold, licensed, or shared on other websites without obtaining consent from the author. If you encounter any issues during the download, it is possible that the publisher has removed the file from their server.
You are allowed to download the files provided on this website for personal or commercial use, subject to the condition that they are used lawfully. All files are the property of their respective owners.
The content on the website is provided AS IS for your information and personal use only. It may not be sold, licensed, or shared on other websites without obtaining consent from the author.
E N D
Presentation Transcript
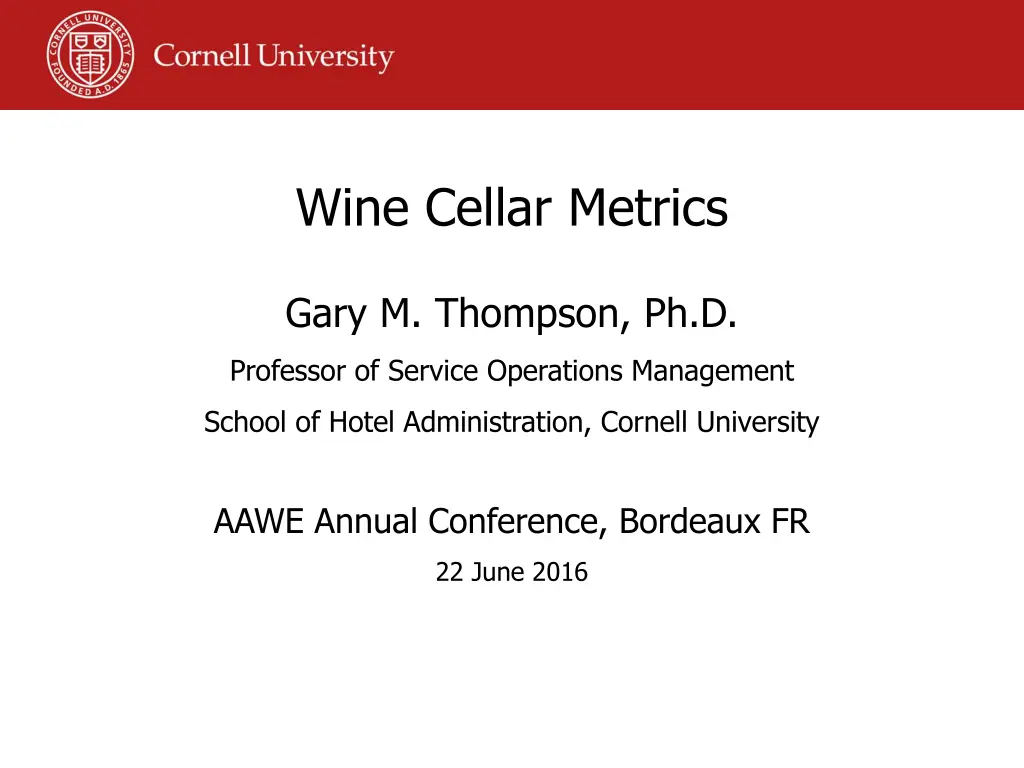
Wine Cellar Metrics Gary M. Thompson, Ph.D. Professor of Service Operations Management School of Hotel Administration, Cornell University AAWE Annual Conference, Bordeaux FR 22 June 2016
Presentation Outline Intro: why cellar wines Goals for the paper Overview of the metrics Two real cellars and charts demonstrating the items being measured Next steps & wrap-up
Why Cellar Wines Isn t it obvious??? How many of you have wine cellars? Our perspective in this paper is that of an cellar owner/manager who wants a stable, robust cellar: Diversity is valuable
Goals for the Paper Introduce metrics for evaluating the status of a wine cellaring. Illustrate use of the metrics using examples of real cellars. Perform a simulation-based study to identify normative values of the metrics. We hope to help those who cellar wines make better decisions (and so enable them to drink better wine).
The Metrics Focus on concentration, meaning overrepresentation of wine: At a similar point in their maturity ( drink window ) That will reach full maturity at the same time That will reach full maturity around the same time From particular countries or regions From particular varietals
Price = Examples: Two Cellars Both cellars contain about 1500 bottles Both cellars have existed at least 10 years Both are in the USA
Price = Concentration By Time: Where in the Drink Window? 0.25 0.2 Proportion of Total Bottles 0.15 Cellar 1 Cellar 2 0.1 0.05 0 0.1 0.2 0.3 0.4 0.5 Proportion of Estimated Peak Life 0.6 0.7 0.8 0.9 1 1.1 >1.1
Price = Concentration by Time: End of Drink Window 0.2 0.18 0.16 0.14 0.12 0.1 Cellar 1 Cellar 2 0.08 0.06 0.04 0.02 0
Price = Concentration by Time: Cumulative Consumption 0.5 0.45 0.4 Proportion of Cumulative Consumption 0.35 0.3 Cellar 1 0.25 Cellar 2 0.2 0.15 0.1 0.05 0 2016 2017 2018 2019 2020 2021 2022 2023 2024 2025 2026 2027 2028 2029 2030 2031 2032 2033 2034 2035
Price = Concentration by Country 0.6 0.5 0.4 Cellar 1 0.3 Cellar 2 0.2 0.1 0 AU DE ES FR IT PT US
Price = Concentration by Varietals 0.45 0.4 0.35 0.3 0.25 Cellar 1 Cellar 2 0.2 0.15 0.1 0.05 0 Bordeaux Nebbiolo Pinot Noir Rhone Sangiovese Tempranillo Zinfandel
Next Steps I have data from two Australian cellars, that I will include as examples Calculating the metrics for the cellars Performing a simulation-based study to establish normative values for the metrics. Important factors are likely to include: Relative capacity of the cellar (in years of consumption) Likelihood of a change in tastes
Q & A Thank you for listening. I m happy to take questions (time permitting). Please ask! gmt1@cornell.edu.