Options Trading Strategies and Market Dynamics
Explore the world of directional options trading with Keith Harwood, focusing on market forces, statistical distributions, breakouts, and breakdowns. Learn about the different technical setups and hedging strategies for educational purposes. Disclaimer: Not financial advice.

Download Presentation

Please find below an Image/Link to download the presentation.
The content on the website is provided AS IS for your information and personal use only. It may not be sold, licensed, or shared on other websites without obtaining consent from the author. If you encounter any issues during the download, it is possible that the publisher has removed the file from their server.
You are allowed to download the files provided on this website for personal or commercial use, subject to the condition that they are used lawfully. All files are the property of their respective owners.
The content on the website is provided AS IS for your information and personal use only. It may not be sold, licensed, or shared on other websites without obtaining consent from the author.
E N D
Presentation Transcript
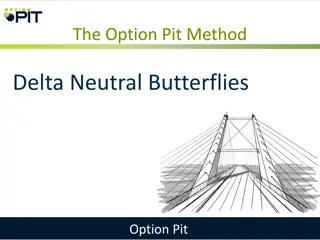
Directional Options Trading Made Easy Part I: Market Forces, Statistical Distributions, and Break Outs/Break Downs Keith Harwood For Educational and Information Purposes Only
Disclosures All Services and Content Are Provided for Educational and Information Purposes Only and Are Not Intended as Legal or Financial Advice. The information and content provided in or through these Services is for educational and informational purposes only. By accessing and/or using the Services you acknowledge that the Services are not intended to be a substitute for legal, investment, or financial advice that can be provided by an attorney, accountant, and/or financial advisor. You further acknowledge that you should not rely solely on the Services in making any investment or financial decision, and should always check with your financial advisor and tax advisor to determine the suitability of any investment. All information provided in or through these Services is strictly informational and is not to be construed as advocating, promoting or advertising registered or unregistered investments of any kind whatsoever. The information is provided as-is and is not guaranteed to be correct, complete, or current. Option Pit and Trade Academy do not guarantee that you will attain a particular result, outcome, or earnings, and you accept and understand that each individual s results will vary and depend on numerous factors. Option Pit and Trade Academy are not investment advisors and are not registered with the U.S. Securities and Exchange Commission ( SEC ) or the Financial Industry Regulatory Authority ( FINRA ). Further, owners, employees, agents or representatives of Option Pit and Trade Academy are not acting as investment advisors and might not be registered with the SEC or FINRA. For Educational and Information Purposes Only
Keith Harwood, MBA >10 years trading options Equities/ETFs, Fixed Income, and Commodities Former Floor Trader and Market Maker Former CTA Manager/Derivatives Strategist Currently Prop Trader and Options Educator at Trade Academy For Educational and Information Purposes Only
The BIG Agenda Market Forces Statistical Distributions Blue Sky Break Outs and Break Downs Short-Squeezes and Long Liquidations Technical Setups that Pair with Verticals and/or Butterflies Technical Setups that Pair with Calendars and/or Diagonals Hedging For Educational and Information Purposes Only
Todays Agenda Market Forces Statistical Distributions Low IV, Blue Sky Break Outs and Break Downs Fair IV, Blue Sky Break Outs and Break Downs High IV, Blue Sky Break Outs and Break Downs Trade Examples For Educational and Information Purposes Only
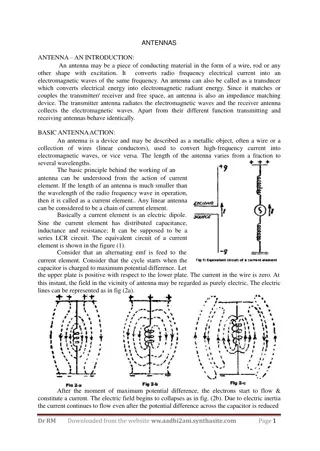
Market Forces There are Naturally sellers of calls and buyers of puts due to hedging activity Options are insurance contracts the retail market is naturally long and looks to hedge Risk OFF scenarios tend to be more violent than risk ON (but not always) For Educational and Information Purposes Only
Statistical Distributions Risk Calculations on Positions are Based Upon Volatility Lower Volatility Larger Positions Higher Volatility Smaller Positions Can you see the driver of Fat Tail Risk? Normal Distribution or Negatively Skewed Return Profile? From Managedfuturesinvesting.com For Educational and Information Purposes Only
Statistical Distributions (continued) S&P 500 Daily Returns Since January 1st, 2001 700 600 500 400 300 200 100 0 -5.00% > 5.00% (-5.00%, -4.80%] (-4.80%, -4.60%] (-4.60%, -4.40%] (-4.40%, -4.20%] (-4.20%, -4.00%] (-4.00%, -3.80%] (-3.80%, -3.60%] (-3.60%, -3.40%] (-3.40%, -3.20%] (-3.20%, -3.00%] (-3.00%, -2.80%] (-2.80%, -2.60%] (-2.60%, -2.40%] (-2.40%, -2.20%] (-2.20%, -2.00%] (-2.00%, -1.80%] (-1.80%, -1.60%] (-1.60%, -1.40%] (-1.40%, -1.20%] (-1.20%, -1.00%] (-1.00%, -0.80%] (-0.80%, -0.60%] (-0.60%, -0.40%] (-0.40%, -0.20%] (-0.20%, 0.00%] (0.00%, 0.20%] (0.20%, 0.40%] (0.40%, 0.60%] (0.60%, 0.80%] (0.80%, 1.00%] (1.00%, 1.20%] (1.20%, 1.40%] (1.40%, 1.60%] (1.60%, 1.80%] (1.80%, 2.00%] (2.00%, 2.20%] (2.20%, 2.40%] (2.40%, 2.60%] (2.60%, 2.80%] (2.80%, 3.00%] (3.00%, 3.20%] (3.20%, 3.40%] (3.40%, 3.60%] (3.60%, 3.80%] (3.80%, 4.00%] (4.00%, 4.20%] (4.20%, 4.40%] (4.40%, 4.60%] (4.60%, 4.80%] (4.80%, 5.00%] For Educational and Information Purposes Only
The Technical Setup - Rectangles I need a horizontal line to signify the break out/break down if I m going to trade to a new high on the break out (or new low on the break down). From Chartpatterns.com
Statistical Distributions (continued) Bimodal Distribution 80 70 60 50 40 30 20 10 0 (0.00, 0.01] (0.01, 0.02] (0.02, 0.03] (0.03, 0.04] (0.04, 0.05] (0.05, 0.06] (0.06, 0.07] (0.07, 0.08] (0.08, 0.09] (0.09, 0.10] (0.10, 0.11] (0.11, 0.12] (0.12, 0.13] (0.13, 0.14] (0.14, 0.15] (0.15, 0.16] (0.16, 0.17] (0.17, 0.18] (0.18, 0.19] (0.19, 0.20] (0.20, 0.21] (0.21, 0.22] (0.22, 0.23] (0.23, 0.24] (0.24, 0.25] (0.25, 0.26] (0.26, 0.27] (0.27, 0.28] (0.28, 0.29] (0.29, 0.30] (0.30, 0.31] (0.31, 0.32] (0.32, 0.33] (0.33, 0.34] (0.34, 0.35] (0.35, 0.36] (0.36, 0.37] (0.37, 0.38] (0.38, 0.39] (0.39, 0.40] (0.40, 0.41] (0.41, 0.42] (0.42, 0.43] (0.43, 0.44] (0.44, 0.45] (0.45, 0.46] (0.46, 0.47] (0.47, 0.48] (0.48, 0.49] (0.49, 0.50] (0.50, 0.51] (0.51, 0.52] (0.52, 0.53] (0.53, 0.54] (0.54, 0.55] (0.55, 0.56] (0.56, 0.57] (0.57, 0.58] (0.58, 0.59] (0.59, 0.60] (0.60, 0.61] (0.61, 0.62] [-0.41, -0.40] (-0.40, -0.39] (-0.39, -0.38] (-0.38, -0.37] (-0.37, -0.36] (-0.36, -0.35] (-0.35, -0.34] (-0.34, -0.33] (-0.33, -0.32] (-0.32, -0.31] (-0.31, -0.30] (-0.30, -0.29] (-0.29, -0.28] (-0.28, -0.27] (-0.27, -0.26] (-0.26, -0.25] (-0.25, -0.24] (-0.24, -0.23] (-0.23, -0.22] (-0.22, -0.21] (-0.21, -0.20] (-0.20, -0.19] (-0.19, -0.18] (-0.18, -0.17] (-0.17, -0.16] (-0.16, -0.15] (-0.15, -0.14] (-0.14, -0.13] (-0.13, -0.12] (-0.12, -0.11] (-0.11, -0.10] (-0.10, -0.09] (-0.09, -0.08] (-0.08, -0.07] (-0.07, -0.06] (-0.06, -0.05] (-0.05, -0.04] (-0.04, -0.03] (-0.03, -0.02] (-0.02, -0.01] (-0.01, 0.00] For Educational and Information Purposes Only
NOT The Technical Setup Flags and Pennants This is not the play for today I ll come back to this. Remember the benefit of the Pennant, though tightening ranges leads often leads to frustrated long Gamma holders. This can help depress Implied Volatility just before the move. From Chartpatterns.com
The Technical Setup Thats Even Better It has all the benefits of a pennant (low HV driving low IV), and all the benefits of a rectangle (no resistance). From Chartpatterns.com
Statistical Distributions (continued) Bimodal Distribution 80 70 60 50 40 30 20 10 0 (0.00, 0.01] (0.01, 0.02] (0.02, 0.03] (0.03, 0.04] (0.04, 0.05] (0.05, 0.06] (0.06, 0.07] (0.07, 0.08] (0.08, 0.09] (0.09, 0.10] (0.10, 0.11] (0.11, 0.12] (0.12, 0.13] (0.13, 0.14] (0.14, 0.15] (0.15, 0.16] (0.16, 0.17] (0.17, 0.18] (0.18, 0.19] (0.19, 0.20] (0.20, 0.21] (0.21, 0.22] (0.22, 0.23] (0.23, 0.24] (0.24, 0.25] (0.25, 0.26] (0.26, 0.27] (0.27, 0.28] (0.28, 0.29] (0.29, 0.30] (0.30, 0.31] (0.31, 0.32] (0.32, 0.33] (0.33, 0.34] (0.34, 0.35] (0.35, 0.36] (0.36, 0.37] (0.37, 0.38] (0.38, 0.39] (0.39, 0.40] (0.40, 0.41] (0.41, 0.42] (0.42, 0.43] (0.43, 0.44] (0.44, 0.45] (0.45, 0.46] (0.46, 0.47] (0.47, 0.48] (0.48, 0.49] (0.49, 0.50] (0.50, 0.51] (0.51, 0.52] (0.52, 0.53] (0.53, 0.54] (0.54, 0.55] (0.55, 0.56] (0.56, 0.57] (0.57, 0.58] (0.58, 0.59] (0.59, 0.60] (0.60, 0.61] (0.61, 0.62] [-0.41, -0.40] (-0.40, -0.39] (-0.39, -0.38] (-0.38, -0.37] (-0.37, -0.36] (-0.36, -0.35] (-0.35, -0.34] (-0.34, -0.33] (-0.33, -0.32] (-0.32, -0.31] (-0.31, -0.30] (-0.30, -0.29] (-0.29, -0.28] (-0.28, -0.27] (-0.27, -0.26] (-0.26, -0.25] (-0.25, -0.24] (-0.24, -0.23] (-0.23, -0.22] (-0.22, -0.21] (-0.21, -0.20] (-0.20, -0.19] (-0.19, -0.18] (-0.18, -0.17] (-0.17, -0.16] (-0.16, -0.15] (-0.15, -0.14] (-0.14, -0.13] (-0.13, -0.12] (-0.12, -0.11] (-0.11, -0.10] (-0.10, -0.09] (-0.09, -0.08] (-0.08, -0.07] (-0.07, -0.06] (-0.06, -0.05] (-0.05, -0.04] (-0.04, -0.03] (-0.03, -0.02] (-0.02, -0.01] (-0.01, 0.00] For Educational and Information Purposes Only
Low IV, Blue Sky Break Outs and Break Downs If Implied Volatility is historically low, I am getting very cheap leverage. I avoid reducing my leverage, and simply buy an outright long option so as to not cap my upside. As a reminder, I DON T CARE about low Historical Volatility here. Since I target a move of 1 standard deviation to the upside (for my time period), I tend to buy outright 30-Delta options as a balance of leverage and probability. I target 3 weeks to expiration since this helps keep me long Gamma but without needing the move to confirm immediately if I catch a trend instead of an explosion, I still win! For Educational and Information Purposes Only
Low IV, Blue Sky Break Outs and Break Downs I look at an exit once the stock hits an individual day 2 standard deviation move. I roll out and up if the stock is grinding higher and IV remains low. If the IV regime changes (ie, IV goes up) but I still want to be in the trade, then I look at different structures and hedges why not take some profits on my long Vega if IV increases? For Educational and Information Purposes Only
Fair IV, Blue Sky Break Outs and Break Downs I really like to keep my upside un-constrained. So rather than adding a short strike, I tighten my strike to be closer to at-the- money and/or shorten the time to expiration. If I shorten the time to expiration, I am betting this thing is explosive NOW, so I need higher conviction on the technical setup (which is naturally necessary if I have no edge on volatility). Into a rally, I would expect IV to drop, so I want to add Delta risk on a per option basis I will end up with fewer long options that have more Delta, so that my Vega risk is lower. There are also ways to hedge my Vega by adding a retracement hedge. This will be discussed later. For Educational and Information Purposes Only
High IV, Blue Sky Break Outs and Break Downs I hate this scenario. I absolutely hate it. The market is aware that the break out is going to happen and is on to the same thing that I am. I have no edge with options, and the market is telling me that they see the same thing, so I have no real edge on technicals relative to the rest of the market. I am best off doing nothing. My technical edge is only a little bit good, my potential for an explosive move is there, and yet, I cannot get leverage easily. Instead, I look for this as an entry on a failed break out or break down, and I will talk about this later, as well. For Educational and Information Purposes Only
Trade Examples ADSK ADM AFL CMI PF For Educational and Information Purposes Only


")

")


")


![Guardians of Collection Enhancing Your Trading Card Experience with the Explorer Sleeve Bundle [4-pack]](/thumb/3698/guardians-of-collection-enhancing-your-trading-card-experience-with-the-explorer-sleeve-bundle-4-pack.jpg)