Outcomes of Participants Switching to F/TAF for PrEP: Week 48 Results
"Results from the DISCOVER Open Label Phase study comparing F/TAF vs. F/TDF for PrEP among MSM and TGW. Includes efficacy, safety, lipid profile, and weight changes data for participants switching medications."
Uploaded on Mar 01, 2025 | 0 Views
Download Presentation

Please find below an Image/Link to download the presentation.
The content on the website is provided AS IS for your information and personal use only. It may not be sold, licensed, or shared on other websites without obtaining consent from the author.If you encounter any issues during the download, it is possible that the publisher has removed the file from their server.
You are allowed to download the files provided on this website for personal or commercial use, subject to the condition that they are used lawfully. All files are the property of their respective owners.
The content on the website is provided AS IS for your information and personal use only. It may not be sold, licensed, or shared on other websites without obtaining consent from the author.
E N D
Presentation Transcript
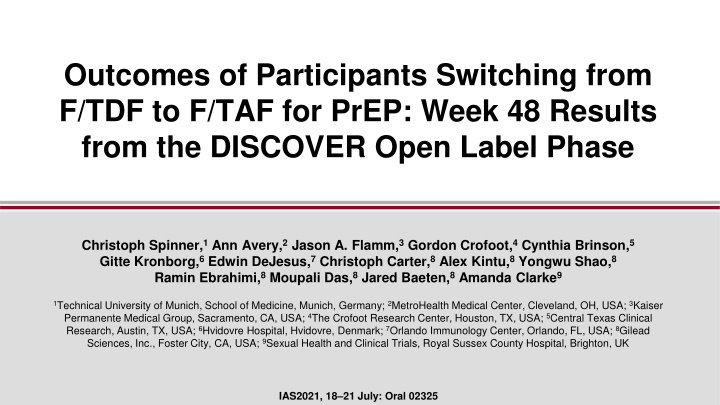
Outcomes of Participants Switching from F/TDF to F/TAF for PrEP: Week 48 Results from the DISCOVER Open Label Phase Christoph Spinner,1Ann Avery,2Jason A. Flamm,3Gordon Crofoot,4Cynthia Brinson,5 Gitte Kronborg,6Edwin DeJesus,7Christoph Carter,8Alex Kintu,8Yongwu Shao,8 Ramin Ebrahimi,8Moupali Das,8Jared Baeten,8Amanda Clarke9 1Technical University of Munich, School of Medicine, Munich, Germany; 2MetroHealth Medical Center, Cleveland, OH, USA; 3Kaiser Permanente Medical Group, Sacramento, CA, USA; 4The Crofoot Research Center, Houston, TX, USA; 5Central Texas Clinical Research, Austin, TX, USA; 6Hvidovre Hospital, Hvidovre, Denmark; 7Orlando Immunology Center, Orlando, FL, USA; 8Gilead Sciences, Inc., Foster City, CA, USA; 9Sexual Health and Clinical Trials, Royal Sussex County Hospital, Brighton, UK IAS2021, 18 21 July: Oral 02325
Disclosures Dr. Spinner reports grants, personal fees, non-financial support and other during the conduct of the study from Gilead Sciences, Janssen-Cilag, GSK/ViiV Healthcare, and MSD; outside the submitted work: grants, personal fees, non- financial support and other from AbbVie and Apeiron, personal fees from Formycon, and grants, personal fees and other from Eli Lilly. This study was funded by Gilead Sciences. 2
Introduction The DISCOVER study (ClinicalTrials.gov NCT02842086) is a Phase 3, randomized, controlled trial of the efficacy and safety of F/TAF vs F/TDF for PrEP among MSM and TGW At the primary analysis (when 100% of participants completed Week 48 and 50% completed Week 96) and at Week 961,2: F/TAF was noninferior to F/TDF in preventing HIV infection F/TAF had significantly better bone and renal safety outcomes vs F/TDF F/TDF was associated with reductions in HDL and LDL cholesterol, while F/TAF was associated with minimal lipid changes F/TDF was associated with weight loss at Week 24 and less weight gain than F/TAF at Weeks 48 and 96 Here we present the results for participants who switched from F/TDF to F/TAF in the OL phase F/TAF, emtricitabine/tenofovir alafenamide; F/TDF, emtricitabine/tenofovir disoproxil fumarate; HDL, high-density lipoprotein; LDL, low-density lipoprotein; MSM, cisgender men who have sex with men; PrEP, pre-exposure prophylaxis; OL, open label; TGW, transgender women who have sex with men. 1. Mayer K et al. Lancet. 2020 Jul 25;396(10246):239-54; 2. Ogbuagu O, et al. CROI 2020, abstr 92. 3
Study Design Week 96 Endpoint 100% Week 96 Present analysis Primary Endpoint 100% Week 48, 50% Week 96 Week 0 96 48 EOBP OL 48 F/TAF 200/25 mg qd: planned n=2500 Randomized 1:1 MSM or TGW aged 18 y F/TAF open-label option F/TDF 200/300 mg qd: planned n=2500 Double blinded, active controlled Eligibility: 2+ episodes of condomless anal sex in the past 12 wk or rectal gonorrhea/chlamydia or syphilis in past 24 wk HIV and hepatitis B virus negative, and eGFRCG 60 mL/min Study conducted in Europe and North America in cities/sites with high HIV incidence Safety assessments Renal: AEs and renal biomarkers Bone: fracture events and BMD Metabolic: fasting lipids, glucose, and body weight changes At EOBP, participants had the option to receive F/TAF in the OL phase AE, adverse event; BMD, bone mineral density; eGFRCG, estimated glomerular filtration rate by Cockcroft-Gault method; EOBP, end of blinded phase. 4
Participant Disposition Through OL Week 48 F/TAF: n=2694 F/TDF: n=2693 532 (20%) Discontinued study 484 (18%) n=2162 Completed blinded phase n=2209 Stay on F/TAF: n=2115 Entered OL phase F/TDF F/TAF: n=2070 255 (12%) Discontinued study 231 (11%) 135 Participant decision 118 97 9 Investigator s discretion 4 6 AE 4 Nonadherence 4* Other Lost to follow-up 88 4 7 10 Completed OL phase or still on study drug n=1860 (88% ) n=1839 (89% ) *1 death, 2 protocol violations, 1 HIV infection; 3 deaths, 3 protocol violations, 1 terminated by sponsor, 3 HIV infections; % of participants entering OL phase. No deaths were related to study drug. 5
Efficacy Analysis: HIV Incidence Rate OL Week 48 Baseline to Week 48 Baseline to Week 96 OL Day 1 to OL Week 48 0.6 HIV Incidence Rate/100 PY (95% CI) 0.5 0.34 0.4 0.30 15 infections/ 4386 PY 15 infections/ 5052 PY 0.3 0.16 0.16 0.09* 2 infections/ 2139 PY 0.2 7 infections/ 4370 PY 8 infections/ 5029 PY 0.05* 1 infections/ 2152 PY 0.1 0 F/TAF n=2670 F/TDF n=2665 F/TAF n=2670 F/TDF n=2665 Stay on F/TAF n=2070 F/TDF F/TAF n=2115 *During the OL phase, one additional participant in each group had a positive quantitative HIV nucleic acid amplification test subsequently confirmed to be false positive. CI, confidence interval; PY, person-years. 6
BMD, Renal Biomarkers and Metabolic Indicators at OL Baseline (Day 1 of the OLE) Stay on F/TAF F/TDF F/TAF p-value BMD Spine, g/cm2 1.032 (1.007, 1.057) 1.002 (0.98, 1.024) 0.082 Hip, g/cm2 1.148 (1.122, 1.175) 1.116 (1.092, 1.139) 0.068 Renal Biomarkers eGFRCG, mL/min 2M:Cr, g/g 119.3 (102.0, 141.6) 114.0 (96.9, 134.4) <0.0001 72.2 (51.1, 106.6) 99.3 (63.8, 202.9) <0.0001 RBP:Cr, g/g 102.0 (74.9, 146.8) 124.8 (88.6, 192.8) <0.0001 Metabolic Indicators LDL, mg/dL 99 (80, 120) 92 (75, 113) <0.0001 HDL, mg/dL 48 (40, 57) 45 (38, 54) <0.0001 Weight, kg 82.3 (73.9, 94.0) 81.0 (72.0, 91.6) 0.0001 BMD data are mean (95% CI) with p-values from analysis of variance (ANOVA) model with treatment as fixed effect; renal biomarker data are median (Q1, Q3) with p-values from Cochran Mantel Haenszel (CMH) test; LDL and HDL data are median (Q1, Q3) with p-values from 2-sided Wilcoxon rank sum test; weight data are median (Q1, Q3) with p-values from ANOVA model with treatment as fixed effect. 2M:Cr; 2-microglobulin:creatinine; RBP:Cr, retinol-binding protein:creatinine. 7
Bone Mineral Density Change at OL Week 48 Hip p=0.03 Spine p=0.0012 2 2 From OL Baseline (95% CI) 1.18 Mean % Change 0.86 1 1 0.20 0 0 -0.06 -1 -1 Stay on F/TAF n=111 F/TDF F/TAF n=106 Stay on F/TAF n=112 F/TDF F/TAF n=106 Participants staying on F/TAF had stable BMD, while those switching from F/TDF F/TAF had BMD increase p-values from ANOVA with treatment as fixed effect. 8
Renal Function: eGFR Through OL Week 48 Stay on F/TAF F/TDF F/TAF Change Absolute eGFR 15 150 Median Change From OL Baseline, * * * * * 10 Median mL/min (Q1, Q3) mL/min (Q1, Q3) 5 119.3 0.3 120 0 116.4 -2.8 114.0 114.0 -5 -10 90 -15 0 12 24 Week 1932 1934 36 48 0 12 24 Week 1932 1934 36 48 Stay on F/TAF, n= F/TDF F/TAF, n= 2070 2114 2015 2050 1272 1264 1667 1666 2070 2114 2015 2050 1272 1264 1667 1666 F/TDF F/TAF participants had eGFR increase, compared to a decrease in those staying on F/TAF *p <0.0001, from CMH test with row mean scores to compare 2 study arms. 9
Renal Function: Markers of Proximal Renal Tubule Dysfunction Through OL Week 48 Stay on F/TAF F/TDF F/TAF 2M:Cr RBP:Cr * 50 50 * * * * * From OL Baseline (Q1, Q3) * 25 25 * Median % Change 0 0 -7.3 -9.9 -25 -25 -26.8 -30.8 -50 -50 -75 -75 0 12 24 Week 1914 1920 36 48 0 12 24 Week 1930 1933 36 48 Stay on F/TAF, n= F/TDF F/TAF, n= 2070 2114 2004 2031 1258 1257 1649 1657 2070 2114 2015 2048 1269 1264 1663 1658 F/TDF F/TAF participants had a greater reduction in markers of proximal renal tubular dysfunction *p <0.0001, from CMH test with row mean scores to compare 2 study arms. 10
Fasting Lipids, Glucose, and Weight Absolute Values and Change at OL Week 48 OL BL OL BL Stay on F/TAF F/TDF F/TAF OL Week 48 OL Week 48 Total LDL HDL Fasting Glucose Total Cholesterol Cholesterol Cholesterol Cholesterol:HDL Triglycerides Weight 6 100 200 183 181 83.782.4 171 80 82.3 81 150 159 3.71 3.73 4 Median mg/dL 60 107 106 105 106 Median kg 3.553.48 Median 96 96 100 99 95 94 94 92 40 87 2 48 48 50 20 48 45 0 0 0 Median change +9 +22 +7 +13 0 +3 +8 +16 +2 +1 +0.15 +0.20 +1.2 +2.0 p <0.001 p <0.001 p <0.001 p <0.001 p=0.86 p=0.015 p <0.001 Lipid and glucose p-values from 2-sided Wilcoxon rank sum test to compare 2 study arms, weight p-values from ANOVA including treatment as fixed effect. 11
Conclusions The DISCOVER open label phase allows for the study of people changing from F/TDF to F/TAF for PrEP Participants who switched from F/TDF to F/TAF in the OL phase demonstrated: A low HIV incidence rate Improvements in eGFR and markers of proximal renal tubule dysfunction Improvement in bone mineral density Increases in LDL, HDL, and weight consistent with removal of weight and lipid suppressive effects of TDF F/TAF is a safe and effective option for PrEP in people currently taking F/TDF for PrEP 12
Acknowledgments We extend our thanks and appreciation to the DISCOVER study participants, their families, and the study investigators. This study was funded by Gilead Sciences, Inc. 13
IAS Specifications Allotted up to eight minutes and will be pre-recorded The scheduled oral abstract sessions with live Q&A last for 50 minutes and consist of three oral presentations of eight minutes each A 20-minute interactive moderated discussion will be held at the end of the session. As a presenter in the session, you will be required to join 45 minutes before the start of the session (additional information and instructions on how to join the session will follow) 14
Fasting Lipids and Glucose Change at OL Week 48 Stay on F/TAF HDL Cholesterol p <0.001 F/TDF F/TAF Total LDL Total Cholesterol p <0.001 Cholesterol p <0.001 Cholesterol:HDL p=0.015 Triglycerides p <0.001 Fasting Glucose p=0.86 1 50 Median Change From OL BL, mg/dL (Q1, Q3) Median Change From OL BL (Q1, Q3) 40 30 0.5 22 20 16 0.20 13 0.15 9 8 7 10 3 1 2 0 0 0 -10 -20 -0.5 171 159 99 92 48 45 95 87 94 94 3.55 3.48 Median BL, mg/dL Median BL 0.7% in the F/TDF F/TAF group and 0.5% in the F/TAF group initiated lipid-modifying medications in the OLE (p=0.54) p-values from 2-sided Wilcoxon rank sum test to compare 2 study arms. 15
Fasting Lipids and Glucose Absolute Values at OL Week 48 Stay on F/TAF F/TDF F/TAF Total LDL HDL Total Cholesterol Cholesterol Cholesterol Cholesterol:HDL Triglycerides Fasting Glucose 6 250 200 183 181 Median mg/dL (Q1, Q3) 4 3.71 3.73 Median (Q1, Q3) 150 107 106 106 105 96 96 100 2 48 48 50 0 0 171 159 99 92 48 45 95 87 94 94 3.55 3.48 Median BL Median BL, mg/dL 16
Fasting Lipids and Glucose Change at OL Week 48 Combined lipids option 1 Stay on F/TAF F/TDF F/TAF Total LDL HDL Total Cholesterol Cholesterol Cholesterol Cholesterol:HDL Triglycerides p <0.001 Fasting Glucose Median Change From OL p <0.001 1 50 p=0.015 From OL BL (Q1, Q3) p <0.001 BL, mg/dL (Q1, Q3) Median Change p <0.001 p=0.86 22 0.5 25 16 13 0.15 0.20 3 9 8 2 1 0 7 0 0 -25 -0.5 6 250 181 183 3.71 3.73 Median (Q1, Q3) Median mg/dL 200 106 105 (Q1, Q3) 4 106 107 150 96 96 100 48 48 2 50 0 0 171 159 99 92 48 45 95 87 94 94 3.55 3.48 Median BL, mg/dL Median BL 0.7% in the F/TDF F/TAF group and 0.5% in the F/TAF group initiated lipid-modifying medications in the OLE (p=0.54) 17 p-values from 2-sided Wilcoxon rank sum test to compare 2 study arms.
Weight Through OL Week 48 Stay on F/TAF F/TDF F/TAF Absolute Weight Change 6 100 Median Change From OL Baseline, * * * Median kg (Q1, Q3) 4 * 90 kg (Q1, Q3) * 83.7 82.4 82.3 2 2.0 1.2 80 81.0 0 70 -2 0 12 24 Week 36 48 0 12 24 Week 36 48 Stay on F/TAF, n= F/TDF F/TAF, n= 2070 2114 2019 2053 1937 1943 1301 1289 1675 1675 2070 2114 2019 2053 1937 1943 1301 1289 1675 1675 p-values from ANOVA including treatment as fixed effect. 18
