Overcoming Challenges in Air Quality Control Strategies
Explore the complexities of complying with ozone and PM2.5 standards, focusing on differentiating impacts by source and scale. Enhance modeling techniques for emissions sectors and key precursors, emphasizing the need for improved spatial and temporal resolution. Address issues related to NO2 modeling and interpretation, VOC relevance, and the utilization of TROPOMI data for effective air quality management.

Download Presentation

Please find below an Image/Link to download the presentation.
The content on the website is provided AS IS for your information and personal use only. It may not be sold, licensed, or shared on other websites without obtaining consent from the author. If you encounter any issues during the download, it is possible that the publisher has removed the file from their server.
You are allowed to download the files provided on this website for personal or commercial use, subject to the condition that they are used lawfully. All files are the property of their respective owners.
The content on the website is provided AS IS for your information and personal use only. It may not be sold, licensed, or shared on other websites without obtaining consent from the author.
E N D
Presentation Transcript
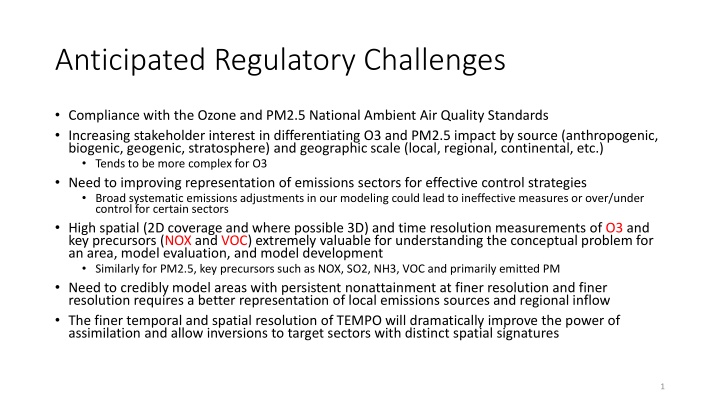
Anticipated Regulatory Challenges Compliance with the Ozone and PM2.5 National Ambient Air Quality Standards Increasing stakeholder interest in differentiating O3 and PM2.5 impact by source (anthropogenic, biogenic, geogenic, stratosphere) and geographic scale (local, regional, continental, etc.) Tends to be more complex for O3 Need to improving representation of emissions sectors for effective control strategies Broad systematic emissions adjustments in our modeling could lead to ineffective measures or over/under control for certain sectors High spatial (2D coverage and where possible 3D) and time resolution measurements of O3 and key precursors (NOX and VOC) extremely valuable for understanding the conceptual problem for an area, model evaluation, and model development Similarly for PM2.5, key precursors such as NOX, SO2, NH3, VOC and primarily emitted PM Need to credibly model areas with persistent nonattainment at finer resolution and finer resolution requires a better representation of local emissions sources and regional inflow The finer temporal and spatial resolution of TEMPO will dramatically improve the power of assimilation and allow inversions to target sectors with distinct spatial signatures 1
NO2 Comparison of NO2 modeled (4 km) and TropOMI at top right and surface level NO2 compared with in-situ routine network data on bottom right If we systematically adjust emissions to match these NO2 columns, how does that inform emissions/chemistry in the modeling system? Are we missing near-surface NO2 emissions (biogenic NO or other)? Upper troposphere NO2 being confused with near-surface NO2? NO2 chemistry lifetime needs improvement? In addition to areas where NO2 gradients are steep, ground-truthing in rural areas needed to make the best use of the TROPOMI/TEMPO products 2
NO2 GEO-TASO NO2 MODEL NO2 High spatial resolution TROPOMI/TEMPO/GCAS/GEO-TASO NO2 column helps understand comparative source strength & useful for model evaluation PANDORA critically important to understand how best to interpret TROPOMI/TEMPO NO2 column data within a regulatory context PANDORA high time resolution data also useful for model evaluation Column density measurements provide an advantage of minimizing/eliminating the influence of surface layer mixing height on in-situ measurements PANDORA & MODEL NO2 3
VOC Q2 Q3 Critical gap is a comparable product for specific VOC relevant for O3 and PM production TROPOMI HCHO may be a useful surrogate for aggregate VOC impact TROPOMI provides useful seasonal changes in formaldehyde Comparatively less spatial structure in current formaldehyde products than NO2 Need for routine and systematic ground truth with PANDORA & that data would also be valuable for high time resolution model evaluation CMAQ CMAQ TROPOMI TROPOMI 4
Episodic O3 & PM2.5 from recurring grassland prescribed fire in the Flint Hills region of KS & OK We see impacts at surface monitors and ceilometer How much confidence in TROPOMI NO2 column levels for these features? Need for verification of recurring episodic large NO2 sources High O3 in Kansas & Oklahoma 5