Explore the oversight and management of state-owned companies by the Treasury, focusing on risk management, responsibilities outlined in the Public Finance Management Act (PFMA), and the governance structure within the National Treasury. Learn about the objectives and principles of the PFMA, borrowing regulations for public entities, and the division responsibilities within the National Treasury for financial analysis and governance.
Please find below an Image/Link to download the presentation.
The content on the website is provided AS IS for your information and personal use only. It may not be sold, licensed, or shared on other websites without obtaining consent from the author. If you encounter any issues during the download, it is possible that the publisher has removed the file from their server.
You are allowed to download the files provided on this website for personal or commercial use, subject to the condition that they are used lawfully. All files are the property of their respective owners.
The content on the website is provided AS IS for your information and personal use only. It may not be sold, licensed, or shared on other websites without obtaining consent from the author.
OVERVIEW a. Risk management and the Public Finance Management Act (PFMA) b. Responsibility within the National Treasury c. SOC Treasury Management d. SOC Risk Themes - Increased Vulnerability Financial leverage - Sovereign Credit Rating 2 2
RISK MANAGEMENT AND THE PUBLIC FINANCE MANGEMENT ACT (PFMA) OBJECTIVE OF THE PFMA Secure transparency, accountability & sound management of revenue, expenditure, assets and liabilities of institutions (management of REAL) UNDERLYING PRINCIPLES OF THE PFMA Responsibility Accountability Promotion of transparency, efficiency, effectiveness and economy Effective management of revenue, expenditure, assets and liabilities Governance structures Improved service delivery 3 3
THE PUBLIC FINANCE MANAGEMENT ACT (PFMA) Section 66 All public entities must annually submit borrowing plans to the Minister of Finance Schedule 2 public entities need approval from the Minister to borrow in a foreign currency or from a foreign entity Schedule 3A SOCs require the approval of the Executive Authority in concurrence with the Minister of Finance to borrow, issue guarantees or indemnities Schedule 3B SOCs require approval of all borrowing from the Minister of Finance 4 4
RESPONSIBILITY WITHIN THE NATIONAL TREASURY GOVERNANCE AND FINANCIAL ANALYSIS Chief -Director ate Mandate: Exercise oversight over public enterprises to achievement of government policy objectives financially sustainable manner National Treasury enable the in a Division: Division: Division: Budget Office Division: Economic Policy Asset and Liability Management Corporate Services Division: Division: Chief Directorate: Governance and Financial Analysis Division: Tax and Financial Sector Policy International and Regional Economic Policy Office of the Accountant General Division: Public Finance Division: Intergovernmental Relations Directorate: Treasury Operation Division: Office of the Chief Procurement Officer
SOC TREASURY MANAGEMENT - STRATEGIC FRAMEWORK Promotion of best practice standards in Treasury Management of SOCs in the following 5 key areas STRATEGIC Treasury Operations Capital Markets and Corporate Financial Cash and Liquidity Risk Management INTEGRATION WITH PFMA AND TREASURY REGULATIONS Management Management and Controls Funding OPERATIONAL 6 6
RISK THEMES INCREASED VULNERABILITY Financial leverage SOVEREIGN CREDIT RATING Impact on the debt of state-owned companies
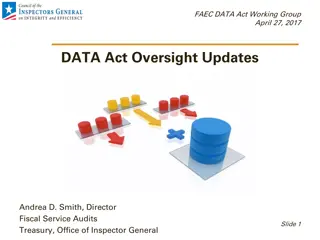
Profitability expected to deteriorate, on the back of weaker economic activity Key financial performance indicators, 2011 -2019 (R Thousand) 500,000,000 10.0% 8.0% 400,000,000 6.0% 300,000,000 4.0% 200,000,000 2.0% 100,000,000 0.0% - -2.0% (100,000,000) -4.0% 10/11 11/12 12/13 13/14 14/15 15/16 16/17 17/18 18/19 Total Income Total Costs Net Profit/ (Loss) Net profit margin (RHS) - CP 2016/17 Net profit margin (RHS) - CP 2015/16 Source: National Treasury ( Schedule 2 SOCs excluding DFIs - ACSA, Alexkor, Armscor, ATNS, CEF, Denel, Eskom, BB Infraco, NECSA, SAA, SABC, SAFCOL, SAPO, SAX, Sentech, TCTA, Transnet) Total income to increase by 11.0% on average in the forecast period, 2% less compared to historical trends (2011/12 - 2014/15); Total cost to increase above inflation levels at an average of 8.0% in the forecast, half of the 16.1% average increase observed historically; Finance costs set to more than double to an average of R34.9 billion a year, compared to an average R16.4 billion observed historically; and Net profit margins are substantially revised down, as the difficult trading condition continue to erode value in SOCs. 9 9
The entities will raise more debt to fund CAPEX, due to the shortfall in profitability Financial leverage, 2011 -2019 (R Thousand) 1,200,000,000 76.0% 74.0% 1,000,000,000 72.0% 800,000,000 70.0% 600,000,000 68.0% 66.0% 400,000,000 64.0% 200,000,000 62.0% - 60.0% 10/11 11/12 12/13 13/14 14/15 15/16 16/17 17/18 18/19 Total Liabilities Equity Debt ratio (RHS) - CP 2016/17 Debt ratio (RHS) - CP 2015/16 Source: National Treasury ( Schedule 2 SOCs excluding DFIs - ACSA, Alexkor, Armscor, ATNS, CEF, Denel, Eskom, BB Infraco, NECSA, SAA, SABC, SAFCOL, SAPO, SAX, Sentech, TCTA, Transnet) SOCs Total Liabilities to increase by an average of 9.2% to more than R1 trillion by 2018/19 driven by increase in debt levels to fund CAPEX. Historically, the average increase was much higher at 14.9%; Equity is to increase on average by 3.9% to R347.5 billion by 2018/19 the growth rate moderated considerably compared to the 8.9% average observed historically -due to profitability constraints; and Debt remains important for SOCs to fund CAPEX as difficult economic conditions put a squeeze on profitability. 10 10
SOCs borrowing requirements driven by CAPEX CAPEX, 2011 -2019 (R Thousand) 140,000,000 120,000,000 100,000,000 80,000,000 60,000,000 40,000,000 20,000,000 - 10/11 11/12 12/13 13/14 14/15 15/16 16/17 17/18 18/19 CAPEX Net Cash From Operations Source: National Treasury ( Schedule 2 SOCs excluding DFIs - ACSA, Alexkor, Armscor, ATNS, CEF, Denel, Eskom, BB Infraco, NECSA, SAA, SABC, SAFCOL, SAPO, SAX, Sentech, TCTA, Transnet) Historically, CAPEX spending has been climbing whilst cash generated from operations contracting. The shortfall between cash generated from operations and CAPEX spending is funded from borrowings. The forecasted cash generated from operations and CAPEX are moving in tandem. 11 11
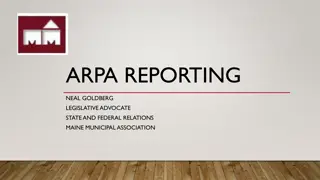
Impact of sovereign downgrade on the debt of state-owned companies Assessment parameters SOCs' Debt At Risk due to Sovereign Downgrade The assessment considered a downgrade (foreign issuances) to a sub-investment grade credit rating by S&P currency The Schedule 2 and 3B entities, i.e., given borrowing powers by the Public Finance Management Act entities surveyed were Creditors raising concerns due to downgrade (54%) 6% Assessment was at 30 September 2015 This exposure or debt at risk, was defined as debt issued by the SOCs where the entities indicated a possible impact as a result of the Sovereign s or the entity s own credit downgrade investment grade as triggered by a debt covenant. Mitigated by SOCs (40%) 40% 54% to sub- Government guarantees or cash transfer (6%) The exposure or debt at risk, includes the impact as a result of cross default clauses being triggered. Survey respondents: Airports Company South Africa, Eskom, Transnet, Trans-Caledon Tunnel Authority, Industrial Development Corporation, Central Energy Fund, Umgeni Water, Denel, South African Express, National Housing Finance Corporation, Rand Water, South African National Roads Agency, Land Bank and South African Airways 12 12
Summary of the Assessment - Impact of a sovereign debt downgrade on the State-owned companies The largest portion, 54% of the total debt at risk, references to the clauses contained in the loan agreements where a Sovereign credit downgrade will not result in a default but will allow creditors to raise concerns. 40% of the exposure relates to entities that have a risk mitigation strategy in place to prevent any adverse outcomes on their debt. The entities will settle the debt linked to credit ratings to avoid any cross-defaults that may impact the entire debt balance. The scenarios mentioned above account for 94% of the total debt at risk. For the balance, the entities would either need additional government guarantees to be issued otherwise a cash injection to repay debt that has been accelerated. The total exposure (debt at risk) that may be impacted by a sub-investment credit downgrade equates to 24% of the balance sheet debt of the SOCs (including debt affected due to cross default). 13 13