Overview of Indian Noble Ferro Alloys - Speaker Udayan Gutgutia
Indian Noble Ferro Alloys including Ferro Molybdenum, Ferro Vanadium, Ferro Niobium, and more are discussed in detail with insights into Ferro Molybdenum's uses, demand projections, and future outlook in India's market. Explore the diverse end uses of Molybdenum in various industries and the reasons behind the high demand for this alloy in stainless steel, alloy steel, and tool steel production.
Download Presentation

Please find below an Image/Link to download the presentation.
The content on the website is provided AS IS for your information and personal use only. It may not be sold, licensed, or shared on other websites without obtaining consent from the author. If you encounter any issues during the download, it is possible that the publisher has removed the file from their server.
You are allowed to download the files provided on this website for personal or commercial use, subject to the condition that they are used lawfully. All files are the property of their respective owners.
The content on the website is provided AS IS for your information and personal use only. It may not be sold, licensed, or shared on other websites without obtaining consent from the author.
E N D
Presentation Transcript
WELCOME TO WELCOME TO PRESENTED BY CONFERENCE 2018 CONFERENCE 2018 OVERVIEW OF INDIAN NOBLE FERRO ALLOYS SPEAKER SPEAKER UDAYAN GUTGUTIA
NOBLE FERRO ALLOYS Types of Noble Ferro Alloys Ferro Molybdenum Ferro Vanadium Ferro Niobium Ferro Tungsten Ferro Nickel Ferro Titanium Ferro Boron Ferro Aluminum
FERRO MOLYBDENUM FERRO MOLYBDENUM
FERRO MOLYBDENUM FERRO MOLYBDENUM ABOUT FERRO MOLYBDENUM FUTURE PRICE PROJECTIONS DEMAND & USES OF FERRO MOLYBDENUM CHALLENGES FOR MOLYBDENUM IN INDIA FUTURE OUTLOOK FACTS & FIGURES 2005-2010(INDIA) REFERENCE LIST DOWNFALL OF MOLY DEMAND IN INDIA DUE TO GLOBAL CRISIS PRESENT SCENARIO OF FERRO MOLYBDENUM IN INDIA
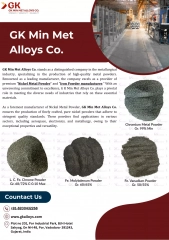
ABOUT FERRO MOLYBDENUM Molybdenum is a refractory metallic element used principally as an alloying agent in steel, cast iron, and superalloys to enhance hardenability, strength, toughness, and wear and corrosion resistance. The same is met through three sources i.e. Scrap, Moly Oxide and Ferro Molybdenum. Moreover, molybdenum finds significant usage as a refractory metal in numerous chemical applications, including catalysts, lubricants, and pigments. During year 2000, price of Moly Oxide was trading between $ 5- $6.5 throughout the year. Though Molybdenum is of volatile nature but the fluctuations were very nominal compared to what it is today. The reasons are obvious. It was then explored that Molybdenum demand will increase decade by decade due to growth of the economies and Steel industry.
DEMAND & USES OF FERRO MOLYBDENUM DEMAND & USES OF FERRO MOLYBDENUM Diverse End Uses of Molybdenum Oil & Gas Chemical/ Petrochemical 4% 3% Automotive 15% 4% Mechanical Engineering 6% Process Industry 7% 15% Other Transportation 8% Power Generation Building & Construction 10% 15% Aerospace & Defence 13% Electronics & Medical Other Applications
DEMAND PROJECTIONS WHY SUCH HIGH DEMAND ??? 1. Making a better Stainless Steel. 2. Making a Stronger Alloy Steel. 3. Making a Long lasting Tool Steel. 4. High Demand has resulted to Mine and Roasting Expansions.
HIGH QUALITY STEEL DEMAND IN CHINA 45 Moly Use/100 tones of steel - 2016 40 Kg MO per 100 MT of crude steel 35 30 25 20 15 10 5 8.6 kg 0 USA Europe Japan China CIS Source: CPM Group, Molybdenum News Service; Chart: CPM Group , World Steel & IMOA Consumes 1/3rd of Global Moly & produces 1/2 of worlds crude & stainless steel China s demand grew 9% YoY since 2017 If China s intensity of use reaches global avg , additional 100.6mn lbs moly /yr will be required.
FACTS & FIGURES 2005 FACTS & FIGURES 2005- -2010 (INDIA) 2010 (INDIA) Production of Ferro Molybdenum during 2005-06 to 2010-11(Quantity in MT) Product 2006-07 2007-08 2008-09 2009-10 2010-11 Ferro Molybdenum 3120 2899 2112 2822 3050 Import of Ferro Molybdenum during 2005-06 to 2010-11(Quantity in MT) Product 2006-07 2007-08 2008-09 2009-10 2010-11 Ferro Molybdenum 262 481 840 1111 963 Export of Ferro Molybdenum during 2005-06 to 2010-11(Quantity in MT) Product 2006-07 2007-08 2008-09 2009-10 2010-11 Ferro Molybdenum 466 820 888 1766 2719
DOWNFALL OF MOLY DEMAND IN INDIA DUE TO GLOBAL CRISIS DOWNFALL OF MOLY DEMAND IN INDIA DUE TO GLOBAL CRISIS Production (Mt) 5,000 4,000 3,000 2,000 1,000 - 2008-09 2009-10 2010-11 2011-12 2012-13 2013-14 2014-15 2015-16 Production (Mt) Consumption of Ferro Molybdenum( 2010 Consumption of Ferro Molybdenum( 2010- -11 to 2015 11 to 2015- -16 16) ) (By industries) (By industries) Industry 2010-11 2011-12 2012-13 2013-14 2014-15 2015-16 Alloy Steel 571 435 435 435 472 950 Electrode 25 31 29 20 17 17 Foundry 50 50 50 57 59 59 Iron & Steel 283 162 162 160 160 423 TOTAL 929 678 676 672 708 1449
PRESENT SCENARIO OF FERRO MOLYBDENUM IN INDIA PRESENT SCENARIO OF FERRO MOLYBDENUM IN INDIA In Jan 17 MoOx was $ 6.28 and doubled by the end of August 2018 at $ 12.5 /lbs Higher top higher bottom pattern since 2017 In 2016-2017 India s consumption was approx. 6000 mt/yr and MoOx 1680 mt/yr Currently India s consumption of Femo is 9600 MT/yr and MoOx is 2400 MT/yr
MOLYBDENUM FUTURE PRICE PROJECTIONS MOLYBDENUM FUTURE PRICE PROJECTIONS Moly prices expected to increase significantly in coming years Further Growth in India- India to grow 7.3% in 2018 versus 6.7% in 2017 Looming Inflation Weaker dollar priced metals like Moly allow foreign buyers greater purchasing power
CHALLENGES FOR MOLYBDENUM IN INDIA CHALLENGES FOR MOLYBDENUM IN INDIA Rising import of duty free molybdenum China s environmental problems resulting in high volatility in price USA IRAN Sanctions affecting Indian business
FUTURE OUTLOOK FUTURE OUTLOOK ACROSS THE WORLD ACROSS THE WORLD INDIA INDIA European demand expected to increase by 105 kt/year till 2025 Strong growth in super Alloys and Stainless Steel Automobiles demand High Strength Steel No potential Substitutes of Molybdenum being used in Various Application No practical alternatives to Molybdenum With Healthy Economic Conditions expected, strong growth can be seen in Stainless Steel More demand for Environment Protection technology- Lower sulphur emissions.
REFERENCE LIST REFERENCE LIST 1. 2. U.S CENSUS BUREAU Indian ferro alloy industry - present status and Future outlook by C.N. Harman (Director Technical), N.S.S. Rama Rao Facor Alloys Limited, IFAPA Indian Minerals Year Book 2013- 52nd Edition, and 2016 55th Edition, , IFAPA, Monthly Statistics of Mineral production March 2016, IBM) Platts BAT reference document for the Non-Ferrous metals industries. 2014. European Commission SMR research, GMO NYSE AMER & TSX IMOA, www.stainlessteel-world.net, stainless steel world September 2017 GMO NYSE AMER & TSX International Molybdenum Association www.imoa.info/index.php 10. CPM Group, Molybdenum News Service. Chart CPM Group, World Steel and IMOA. GMO NYSE AMER & TSX 11. IMOA, www.stainlessteel-world.net, stainless steel world September 2017 12. Indian Minerals Year Book 2016 55th Edition 13. https://roskill.com/product/molybdenum/ 14. Current and future needs of selected refractory metals in EU EU-H2020-MSP-REFRAM 15. Thompson Creek Mining Company, 2001, Thompson Creek Mining Company reduces mine production: Clayton, ID, Thompson Creek Mining Company news release, January 16, 1 p. U.S. GEOLOGICAL SURVEY MINERALS YEARBOOK 2000 16. Bloomberg, BMO Capital Markets, 3/2/18., GMO NYSE AMER & TSX 17. CPM Group s October 2017 Molybdenum Market Outlook Update Report projected real prices based on 2017 real dollars. 2018 price projection updated in February 2018. Platts 3. 4. 5. 6. 7. 8. 9.
FERRO VANADIUM FERRO VANADIUM
FERRO VANADIUM ABOUT FERRO VANADIUM STEEL PRODUCTION AND VANADIUM CONSUMPTION PAST TO PRESENT PERFORMANCE OF VANADIUM VANADIUM PRODUCTION, CONSUMPTION AND EXPORT OF INDIA. PRICE OF V2O5 AND FEV 80% SINCE 2015 FUTURE CONSUMPTION, DEMAND AND PRODUCTION PROJECTIONS DEMAND PROJECTIONS OF ENERGY STORAGE APPLICATION VANADIUM TERMED AS A GREEN METAL FUTURE OUTLOOK REFERENCE LIST
ABOUT FERRO VANADIUM Vanadium is a grey, soft, ductile high value metal with several unique characteristics that position it well in steel, alloys and chemical sectors. Its characteristics are High Strength to weight ratio, Corrosion Resistance, Fabric ability, Weld ability and is water soluble VANADIUM PRODUCTION IN 2015 VANADIUM PRODUCTION IN 2015 Production China Russia S.Africa N. America Europe Japan Korea Taiwan India Brazil 0% 1% 1% 2% 3% 8% 7% 12% 56% 10%
STEEL PRODUCTION AND VANADIUM CONSUMPTION STEEL PRODUCTION AND VANADIUM CONSUMPTION The steel Industry accounts for >90% of total vanadium consumption Since 2009 the consumption has significantly increased as good as 6.1% CAGR
VANADIUM CONSUMPTION HISTORY The best performing battery metal of 2017 is Vanadium Consumption grew at CAGR of 0.90% since 2007 Steel production growth of 0.72% CAGR since 2007 China is the largest Consumer with a market share of 42% in 2017 India s Consumption is just 3-4% compared to China s Consumption
PAST TO PRESENT PERFORMANCE PAST TO PRESENT PERFORMANCE FeV Mid Price US$/kg 100 80 60 40 20 0 April'13 April'18 May'15 Mar'16 Nov'12 Nov'17 Feb'14 Dec'14 Sept'13 Oct'15 Aug'18 Aug'16 June'12 June'17 Jan'12 July'14 Jan'17 FeV Mid Price US$/kg Vanadium Prices grew 72% in 2016 and has continued in 2018 up approx. 68% year to date. Vanadium prices have grown 5 fold since Nov 15
PRODUCTION, EXPORT AND CONSUMPTION OF PRODUCTION, EXPORT AND CONSUMPTION OF INDIA INDIA Production of Ferro Vanadium during 2005-06 to 2010-11(Quantity in MT) Product 2006-07 2007-08 2008-09 2009-10 2010-11 Ferro Vanadium 1139 1585 1501 1389 1500 Import of Ferro Vanadium during 2005-06 to 2010-11(Quantity in MT) Export of Ferro Vanadium during 2005-06 to 2010-11(Quantity in MT) Product 2006-07 2008-09 2009-10 2010-11 2007-08 Product 2006-07 2007-08 2008-09 2009-10 2010-11 Vanadium 1971 787 387 30 169 Vanadium 523 195 242 881 891 Consumption of Ferro Vanadium during 2013-14 to 2015-16(Quantity in MT)* By Industries Industries 2013-14 2014-15 2015-16(P) Iron & Steel 1079 1083 1020 Alloys Steel 26 43 80 Electrode 1 1 2 Foundry 4 4 4 All Industries 1110 1131 1106 Currently India Produces 5000 MT /year of Ferro Vanadium and 300 MT is being exported per year.
PRICE OF V2O5 AND FEV 80% SINCE 2015 PRICE OF V2O5 AND FEV 80% SINCE 2015 The price of V2O5 and Ferro Vanadium has rose almost 5 times since Aug 15 till Aug 18 Price of V2O5 and FeV was at its peak in Aug 18 in past 5 years.
FUTURE CONSUMPTION, DEMAND AND PRODUCTION PROJECTIONS FUTURE CONSUMPTION, DEMAND AND PRODUCTION PROJECTIONS Demand is projected to grow at a CAGR of 6% per year through 2020 Current demand is ahead of production, Global inventory levels are decreasing. Compliance with new Chinese rebar standards increase for Construction Activity. Forecast of Vanadium demand by 30% in next 10 years Steel Market set to continue supporting robust vanadium demand, growing by 2.24% CAGR from 2017 to 2027. The Indian alumina plants, having very low content of vanadium may not be able to generate adequate quantity of vanadium sludge to meet the internal demand.
DEMAND PROJECTIONS OF ENERGY STORAGE APPLICATION DEMAND PROJECTIONS OF ENERGY STORAGE APPLICATION Vanadium Electrolyte expected to reach 20% of global Vanadium consumption by 2030 compared to 2% Huge Demand in Energy Storage applications, and by 2020 Vanadium consumption will grow 2 fold. Potential to increase global vanadium consumption by more than 27,000 MTV /year than current market by 2020.
VANADIUM TERMED AS A VANADIUM TERMED AS A GREEN GREEN METAL METAL It is used in pollution control catalysts to eliminate Sox and NOx from power station and industrial gas emissions. Helps in effective, efficient solutions to grid level and mobility energy storage solutions which will have a critical impact on the global environment in the coming decade. Vanadium catalysts allow for the efficient production of sulfuric acid, maleic anhydride.
FUTURE OUTLOOK FUTURE OUTLOOK Increasing demand in Batteries will drive the vanadium price in coming years. The surge in vanadium prices since the second half of 2017, is change in Chinese policies on vanadium content in steel alloys and alternative battery metals. China has been ruminating about increasing the vanadium content in steel to make it stronger, while vanadium s potential in mass electricity storage devices, or vanadium redox batteries (VRB), have also made it appealing to investors
REFERENCE LIST REFERENCE LIST 1. Bushveld Minerals analysis, TTP squared 2. Terry Perles, TTP squared, Inc., Quebec Mines. 3. Terry Perles, TTP squared, Inc., Quebec Mines. 4. Bushveld Minerals analysis, Roskill Bloomberg, Metal Bulletin, April 2018 5. Indian ferro alloy industry - present status and Future outlook by C.N. Harman (Director Technical), N.S.S. Rama Rao Facor Alloys Limited, IFAPA 6. Indian Minerals Year Book 2016 55th Edition 7. https://www.vanadiumprice.com 8. TTP Squared Inc, Bushveld Minerals analysis, Roskill, World Steel Association, Bloomberg New Energy Finance. 9. Terry Perles, TTP squared, Inc., Quebec Mines, Bushveld Minerals analysis, Kevin Jones, Camelot Coal, Ryans Notes Ferroalloys Conference presentation, Oct. 30, 2012 Miami, Fl USA 10. terry@ttpsquared.com, Terry Perles, TTP squared, Inc., Quebec Mines. 11. https://www.vanadiumprice.com/vanadium-metal-watch-2018-analyst-says/
FERRO NIOBIUM FERRO NIOBIUM
FERRO NIOBIUM FERRO NIOBIUM ABOUT FERRO NIOBIUM FERRO NIOBIUM CONSUMPTION IMPORT OF FERRO NIOBIUM IN INDIA FERRO NIOBIUM PRICING DEMAND PROJECTIONS FUTURE OUTLOOK REFERENCE LIST
ABOUT FERRO NIOBIUM 90% of the world's Niobium is produced by three mines, two of which are in Brazil(the Arax and Catalao mines) and the other in Canada (the Niobec mine). Pie chart shows the world production of Niobium. Pie chart shows the world production of Niobium. Production in % Brazil(89.91) European Union (0.00) Burundi (0.02) Canada (9.18) China (0.03) Congo (0.26) Ethiopia (0.01) Mozambique (0.03) Nigeria (0.04) Rwanda (0.64)
FERRO NIOBIUM CONSUMPTION FERRO NIOBIUM CONSUMPTION China & Europe are the Biggest consumer of Ferro niobium in the world. Irony No production of Niobium in China & Europe 30 25 20 Consumption (%) 15 10 5 0 China USA Japan Germany Rest of Europe S.Korea Canada & Mexico others IMPORT OF NIOBIUM IN INDIA IMPORT OF NIOBIUM IN INDIA Import during Import during 2016 2016 to to 2018 2018 till date till date (Quantity in MT (Quantity in MT) ) Product 2016-17 2017-18 2018 till date Ferro Niobium 1665 2303 1623
FERRO NIOBIUM PRICING FERRO NIOBIUM PRICING Since 1991 to 2005 the prices of Niobium was at a constant levels of $ 10-15 per kg. Since 2005 to 2015 the prices of niobium rose almost 4 times to $ 44 per kg . Future Pricing expected to remain same with very limited volatility. 45 40 35 30 25 FERRO NIOBIUM - (US$/kg) 20 15 10 5 0 1991 1993 1995 1997 1999 2001 2003 2005 2007 2009 2011 2013 2015
DEMAND DEMAND FORECAST FORECAST Demand has increased at average growth rate of 6.9% per year Currently about 10% of the steel produced globally contains niobium, expected to rise by 20% in future.
FUTURE OUTLOOK FUTURE OUTLOOK Sharp growth in demand is expected between now and 2020 for Ferro-Niobium driven by a global demand for steel. The demand for Ferro Niobium in the EU will remain high as much as 8% per year Longer term demand for HSLA steels will almost inevitably return to long-term growth in Automobile and Construction Industry
REFERENCE LIST MSP Refram, http://prometia.eu/msp-refram Cradle Resources, Roskill, Edison Investment Research Indian ferro alloy industry - present status and Future outlook by C.N. Harman (Director Technical), N.S.S. Rama Rao Facor Alloys Limited, IFAPA Cradle Resources, Global Trade Atlas E. Commission, Report on Critical Raw Materials for the EU, European Commission, 2015. D1.1 Current and future needs of selected refractory metals in EU MSP REFRAM EU H2020 project
Thank You Thank You SPEAKER SPEAKER UDAYAN GUTGUTIA PRESENTED BY

