Overview of Medicaid
Overview of Medicaid and its federal-state partnership, financing structure, key management tools, and impact on states' spending. Exploring the nuances of Medicaid funding and coverage.

Download Presentation

Please find below an Image/Link to download the presentation.
The content on the website is provided AS IS for your information and personal use only. It may not be sold, licensed, or shared on other websites without obtaining consent from the author.If you encounter any issues during the download, it is possible that the publisher has removed the file from their server.
You are allowed to download the files provided on this website for personal or commercial use, subject to the condition that they are used lawfully. All files are the property of their respective owners.
The content on the website is provided AS IS for your information and personal use only. It may not be sold, licensed, or shared on other websites without obtaining consent from the author.
E N D
Presentation Transcript
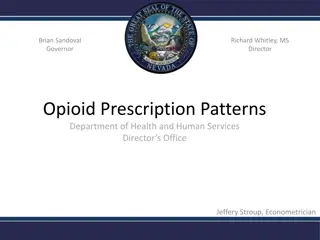
Advancing innovations in health care delivery for low-income Americans Overview of Medicaid September 30, 2020 Mark Larson, Senior Vice President Lauren Moran, Senior Program Officer www.chcs.org | @CHCShealth
About the Center for Health Care Strategies A nonprofit policy center dedicated to improving the health of low-income Americans 2
Federal-State Partnership: A Marriage with Tension Federal State plan amendments (SPAs) and waivers are used by states to get federal approval to make changes to their Medicaid program Push-pull of federalism and states rights since the start of US government government pays half the national cost of Medicaid = serious influence over program 4
The Four Key Tools of Medicaid Management How is it delivered? What s covered? Who s covered? How is it financed? 5
Whos Covered? How s It Delivered? What s Covered? How s It Financed? How s Medicaid Financed? 6
Medicaid Financing in a Nutshell State-Federal Share Feds pay guaranteed percentage of all costs Determined by FMAP (federal medical assistance percentage) resulting in FFP (federal financial participation) Feds Provider Larger FMAP in states with lower per capita incomes State Different percentages for administration (50 percent) and IT (75 or 90 percent) State share must be public dollars and 40% must be from state general revenues 7
FMAPs and Leverage of State Dollar Gross Spend FMAP State Spend Federal Match Multiplier $200 50% $100 $100 1:1 $200 $333 70% 70% $60 $100 $140 $233 1:2.33 1:2.33 States with higher FMAP spend less to purchase covered services compared to a lower FMAP state States with higher FMAP require deeper cuts to reduce state general fund spending than lower FMAP states 8
When will Medicaid pay? Is the individual enrolled? Is it a Medicaid- covered service? FMAP Is the service medically necessary? Is it a Medicaid- enrolled provider? 9
States Like Flexibility: Waivers vs State Plan State Plan Waivers Flexibility within existing federal regulations* Flexibility beyond existing federal regulations *State level legislative and budget authority is a separate issue 10
Whos Covered? How s It Delivered? How s It Financed? What s Covered? Who s Eligible for Medicaid? 11
Medicaid Eligibility Groups and Eligibility Determination Criteria Mandatory Groups Pregnant women (60 days postpartum) and children up to 6 years at 138% FPL Optional Groups Pregnant women and infants with income > 138% FPL Children 6-19 years, 138% FPL Children >138% FPL Individuals receiving SSI and related programs Non-disabled, childless adults, ages 19-64 (Expansion) Modified Adjust Gross Income Came into effect with the ACA Categorical Eligibility Individuals receiving SSI All states use MAGI criteria for determining income-based eligibility Aged, blind, and disabled individuals Children with Title IV-E Adoption Assistance, foster care, or guardianship care MAGI = streamlined criteria between Medicaid and marketplace Qualified Medicare beneficiaries 12
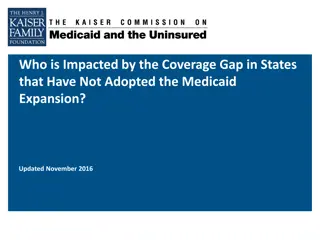
Current State of Medicaid Expansion 13 Source: Status of State Action on the Medicaid Expansion Decision. Kaiser Family Foundation. Aug 2020.
Hows It Delivered? Who s Covered? How s It Financed? What s Covered? What s Covered by Medicaid? 14
The Skinny on Medicaid Benefit Design Mandatory Optional Inpatient hospitalization Outpatient hospital Lab and x-ray Home health Nursing facility Early and Periodic Screening, Diagnostic and Treatment (EPSDT) for children Prescription drugs Eyeglasses and hearing aids Organ Transplants Psychologists and other behavioral health Podiatrists Dental Hospice States use a State Plan Amendment (SPA) to add optional benefits. Additional benefits can also be added through waivers. 15
What is EPSDT? Early and Periodic Screening, Diagnostic, and Treatment Early Assessing and identifying problems early Checking children's health at periodic, age-appropriate intervals Periodic Providing physical, mental, developmental, dental, hearing, vision, and other screening tests to detect potential problems Screening Performing diagnostic tests to follow up when a risk is identified Diagnostic Treatment Control, correct, or reduce identified issues 16
10 Essential Benefits Ambulatory patient services Prescription drugs Rehabilitative and habilitative services and devices Emergency services Hospitalization Laboratory services Maternity and newborn care Preventive/wellness services and disease management Mental health and substance use disorder services Pediatric services, including oral and vision care 17
Hows It Delivered? Who s Covered? How s It Financed? What s Covered? How Are Medicaid Services Delivered? 18
States have an Array of Delivery System Options Fee-for-Service Some Primary Care Case Management combination! Administrative Services Organization Accountable Care Organization Managed Care 19
Advancing innovations in health care delivery for low-income Americans Question & Answer 20 www.chcs.org | @CHCShealth
Medicaids Impact in Nevada 1 in 4 Nevadans covered by Medicaid 87,269 Growth in Medicaid recipients since February 2020 (14%) $4 billion Medicaid expenditures in SFY20 (nearly 30% of total state expenditures) 60 percent Births in Nevada covered by Medicaid 76 percent Medicaid recipients served through managed care 42 percent Medicaid recipients aged 0-18 96,696 Dually eligible for Medicare and Medicaid (11%) $932 million SFY19 Medicaid expenditures on individuals with disabilities $279 million SFY19 Medicaid expenditures on individuals age 65+ 62 percent Medicaid covered nursing facility bed days 21