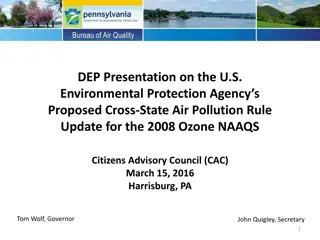
This briefing outlines the Regulatory Impact Analysis for the Proposed Cross-State Air Pollution Rule (CSAPR) pertaining to the 2008 Ozone National Ambient Air Quality Standards (NAAQS). It covers the methodology, emissions baseline, control case, costs, benefits, economic impacts, and more. The analysis estimates baseline air quality in 2017, emission reductions, costs associated with control strategies, total benefits, and the transport region affected by the proposal.
Please find below an Image/Link to download the presentation.
The content on the website is provided AS IS for your information and personal use only. It may not be sold, licensed, or shared on other websites without obtaining consent from the author. If you encounter any issues during the download, it is possible that the publisher has removed the file from their server.
You are allowed to download the files provided on this website for personal or commercial use, subject to the condition that they are used lawfully. All files are the property of their respective owners.
The content on the website is provided AS IS for your information and personal use only. It may not be sold, licensed, or shared on other websites without obtaining consent from the author.
E N D
Presentation Transcript
Regulatory Impact Analysis for the Proposed Cross-State Air Pollution Rule (CSAPR) for the 2008 Ozone National Ambient Air Quality Standards (NAAQS) Briefing for Interagency Workgroup U.S. Environmental Protection Agency October 7, 2015 *** E.O. 12866 Review Draft Do Not Cite, Quote, or Release During Review ***
Outline of this Briefing Overview of RIA Methodology and Transport Region Baseline and Control Case Emissions for the 23- State Affected Region Emissions, Costs, and Benefits Results in 2017 for the 23-State Affected Region Discussion of Additional Economic and Other Impacts 2 *** E.O. 12866 Review Draft Do Not Cite, Quote, or Release During Review ***
Estimate 2017 Baseline Air Quality Overview of RIA Methodology *** E.O. 12866 Review Draft Do Not Cite, Quote, or Release During Review *** Estimate Emissions Reductions From the Proposed & Alternative Standards Calculate Costs Associated with EGU Control Strategies Calculate Benefit / Ton Estimates Using Air Quality Model Output Adjust Costs for Factors Exogenous to IPM and Calculate Economic Impacts Conduct Benefits Analysis Using BenMAP and Benefit/Ton Estimates Estimate Total Costs Estimate Total Benefits 3
Overview of the Transport Region Overview of the Transport Region Nonattainment and Maintenance Receptors Identified for this Proposal and Upwind States Linked to these Downwind Air Quality Problems with Respect to the 2008 Ozone NAAQS 4 *** E.O. 12866 Review Draft Do Not Cite, Quote, or Release During Review ***
Estimating the 2017 Baseline and Control Case Emissions for the 23-State Region Baseline: The baseline is a projection of air quality in the analysis year of 2017, taking into account currently on-the-books Federal regulations and other Federal and state actions. The baseline for the RIA analysis incorporates a large number of EPA regulations, including CSAPR, MATS, Tier III, Regional Haze, and the Clean Power Plan. Control Case: Ozone season NOx budgets for each state reflect Electric Generating Unit (EGU) NOxreduction strategies that are widely available at a uniform cost of $1,300 per ton of NOx for affected EGUs. These budgets reflect turning on idled selective catalytic reduction (SCR) and upgrading combustion controls. Less and More Stringent Alternatives: The RIA analyzes less and more stringent alternatives based on uniform NOx control costs of $500 per ton and $3,400 per ton, respectively. 5 *** E.O. 12866 Review Draft Do Not Cite, Quote, or Release During Review ***
Methodology for Developing Cost Estimates IPM v.5.15 basis of cost & benefits analysis IPM Baseline is from CPP final option (rate based). IPM constraints beyond CPP Each state must meet NOx assurance level (121% of state budget) 23 state region must meet overall regional budget No new capacity or post-combustion controls before 2020 Existing SCRs to operate to 0.075 lbs/MMBtu (less stringent opt). Idled SCRs must operate (proposal) Install state-of-art combustion side controls if needed (proposal) Idled SNCRs must operate (most stringent) 6 *** E.O. 12866 Review Draft Do Not Cite, Quote, or Release During Review ***
Control Strategy Results Summary of Emissions Reductions in 23 Affected States and Nation (National Reductions in parentheses) Projected 2017 EGU Emissions Reductions of NOx, SO2, and CO2 with the Proposed NOx Emissions Budgets and More and Less Stringent Alternatives (tons/year)* More Stringent Alternative Less Stringent Alternative Pollutant Proposal 82,000 (85,000) 84,000 (87,000) 24,000 (24,000) NOx - ozone season 91,000 (90,000) 93,000 (93,000) 24,000 (24,000) NOx annual 1,200 (380) 1,300 (430) 1,000 (300) SO2 - annual 1,300,000 (610,000) 1,600,000 (610,000) 1,200,000 (720,000) CO2 (annual) *All tons are reported in short tons. Note: some of the emission estimates in this table differ from the estimates in the draft RIA and Preamble submitted for interagency review on 9/28/15 7 *** E.O. 12866 Review Draft Do Not Cite, Quote, or Release During Review ***
Control Strategy Results 2017 Change* in Coal and Natural Gas Consumption in Power Sector Projected 2017 Changes in Coal (by source region) and Natural Gas Use in Power Sector More Stringent Alternative Less Stringent Alternative Proposal -321,000 (-0.05%) -363,000 (-0.05%) -317,000 (-0.05%) Coal: National Total (tons) -433,000 (-0.39%) -643,000 (-0.57%) -390,000 (-0.35%) Appalachia ~0 -92,000 (-0.04%) ~0 Interior +112,000 (+0.03%) +371,000 (+0.11%) +73,000 (+0.02%) West Natural Gas: National Total (BCF) *Coal use is in short tons;natural gas usage is in billion cubic feet (BCF) +10,000 (+0.11%) +13,000 (+0.13%) +9,000 (0.09%) 8 *** E.O. 12866 Review Draft Do Not Cite, Quote, or Release During Review ***
Total Annual Costs for 23 Affected States, 2017 (millions of 2011$) Cost estimates (2011$) for proposal and more and less stringent alternatives Annualized* Policy Proposal $92,900,000 More Stringent Alternative $95,700,000 Less Stringent Alternative $4,700,000 *Costs are annualized over the period 2016 through 2040 using the 4.77 discount rate used in the IPM model s objective function for minimizing the net present value of the stream of total costs of electricity generation. Costs include those for monitoring, recordkeeping, and reporting as well as control costs. 9 *** E.O. 12866 Review Draft Do Not Cite, Quote, or Release During Review ***
Methodology for Developing Benefits Estimates EPA quantified the number and dollar value of avoided ozone- and PM2.5- related health impacts, and the value of climate-related co-benefits for the RIA. Consistent with other EPA rules, we follow a damage-function approach in calculating benefits. We estimate the number of avoided cases of death and illness and assign dollar values to those changes. We use a benefit-per-ton approach to estimate the quantified ozone and PM2.5 benefits in the RIA. We conducted air quality modeling for an illustrative control case, which was used to generate benefit-per-ton estimates specific to this proposal. We monetize the climate-related co-benefits of CO2 reductions using the social cost of carbon (SC-CO2) SC-CO2 estimates the monetary value of impacts associated with marginal changes in CO2 emissions in a given year. 10 *** E.O. 12866 Review Draft Do Not Cite, Quote, or Release During Review ***
Health Benefits Results in 2017 Summary of Avoided Health Incidences from Ozone-Related and PM2.5-Related Benefits for the Proposal for 2017* Proposal More Stringent Alternative Less Ozone-related Health Effects Stringent Alternative Avoided Premature Mortality Smith et al. (2009) (all ages) Zanobetti and Schwartz (2008) (all ages) Avoided Morbidity Hospital admissions respiratory causes (ages > 65) Emergency room visits for asthma (all ages) Asthma exacerbation (ages 6-18) Minor restricted-activity days (ages 18-65) School loss days (ages 5-17) PM2.5-related Health Effects Avoided Premature Mortality Krewski et al. (2009) (adult) Lepeule et al. (2012) (adult) Woodruff et al. (1997) (infant) Avoided Morbidity Emergency department visits for asthma (all ages) Acute bronchitis (age 8 12) Lower respiratory symptoms (age 7 14) Upper respiratory symptoms (asthmatics age 9 11) Minor restricted-activity days (age 18 65) Lost work days (age 18 65) Asthma exacerbation (age 6 18) Hospital admissions respiratory (all ages) Hospital admissions cardiovascular (age > 18) Non-Fatal Heart Attacks (age >18) Peters et al. (2001) Pooled estimate of 4 studies * Co-benefits for ozone are based on ozone season NOX emissions. *** E.O. 12866 Review Draft Do Not Cite, Quote, or Release During Review *** 48 81 50 83 14 24 79 320 93,000 240,000 77,000 81 330 95,000 240,000 79,000 23 94 27,000 70,000 23,000 21 48 0 22 50 0 5.6 13 0 12 31 390 560 16,000 2,700 580 6.4 7.8 12 32 400 570 16,000 2,700 600 6.5 8.0 3.1 8.1 100 150 4,200 700 150 1.7 2.1 25 2.7 26 2.8 6.6 0.7 11
Total Annual Benefits for 23 Affected States, 2017 (millions of 2011$) Combined Health Benefits and Climate Co-Benefits for Proposal and for More and Less Stringent Alternatives for 2017 (millions of 2011$)* Health and Climate Benefits (Discount Rate Applied to Health Co-Benefits) 3% Climate Co- Benefits Only SC-CO2 Discount Rate** 7% Less Stringent Alternative 5% 3% 2.5% 3% (95th percentile) Proposal 5% 3% 2.5% 3% (95th percentile) More Stringent Alternative 5% 3% 2.5% 3% (95th percentile) $200 to $350 $220 to $370 $230 to $390 $270 to $420 $200 to $340 $220 to $360 $230 to $380 $270 to $410 $7.6 $27 $41 $78 $680 to $1200 $700 to $1200 $710 to $1300 $740 to $1300 $660 to $1200 $680 to $1200 $690 to $1200 $720 to $1200 $6.5 $23 $35 $66 $700 to $1300 $720 to $1300 $730 to $1300 $760 to $1300 $680 to $1200 $700 to $1200 $710 to $1200 $740 to $1300 $6.5 $23 $35 $66 *All estimates are rounded to two significant figures. Co-benefits are based on benefit-per-ton estimates. Benefits for ozone are based on ozone season NOX emissions. Ozone benefits occur in analysis year, so they are the same for all discount rates. The health benefits range is based on adult mortality functions (e.g., from Krewski et al. (2009) with Smith et al. (2009) to Lepeule et al. (2012) with Zanobetti and Schwartz (2008)). Climate co-benefits are based on reductions in CO2 emissions. The monetized health co-benefits do not include reduced health effects from directly emitted PM2.5, direct exposure to NO2, SO2, and hazardous air pollutants; ecosystem effects; or visibility impairment. 12 *** E.O. 12866 Review Draft Do Not Cite, Quote, or Release During Review ***
Total Monetized Costs and Benefits for 2017 (millions (millions of 2011 of 2011$) $) Total Costs, Total Monetized Benefits, and Net Benefits of the Proposal and More or Less Stringent Alternatives for 2017 for U.S. (millions of 2011$)a,b,c,d More Stringent Alternative Proposal Less Stringent Climate Co-Benefits $23 $23 $27 Air Quality Health Benefits $700 to $1200 $720 to $1300 $220 to 370 Total Benefits $720 to $1200 $740 to $1300 $250 to $400 Annualized Compliance Costs $93 $96 $5 Net Benefits $630 to $1100 $640 to $1200 $250 to $400 Non-monetized climate benefits Reductions in exposure to ambient NO2 and SO2 Reductions in mercury deposition Ecosystem benefits assoc. with reductions in emissions of NOx, SO2, and PM Visibility impairment Non-Monetized Benefitsd a Estimating multiple years of costs and benefits is limited for this RIA by data and resource limitations. As a result, we provide a snapshot of costs and benefits in 2017, using the best available information to approximate social costs and social benefits recognizing uncertainties and limitations in those estimates. b Benefits ranges represent discounting of health benefits and climate co-benefits at a discount rate of 3%. The costs presented in this table reflect engineering costsannualized at an approximately 5 percent discount rate to the extent possible and monitoring, recordkeeping, and reporting costs. C All costs and benefits are rounded to two significant figures; rows may not appear to add correctly. d Non-monetized benefits descriptions are for all three alternatives and are qualitative. 13 *** E.O. 12866 Review Draft Do Not Cite, Quote, or Release During Review ***
Additional Economic Impacts Price changes in electricity, coal, and natural gas for proposal alternative are low (0.4 percent or less nationally), and negative. Price changes estimated using Retail Price Model (RPM) that uses inputs from IPM analysis results. Regional price changes are generally within the magnitude for the national price changes We certify no SISNOSE based on the results of the small entity analysis (7 small entities affected, one with net compliance costs greater than 1% of revenues). Qualitative assessments of economic impacts and employment all impacts likely to be minimal given the retail energy price changes mentioned above and relatively limited amount of new or upgraded control measures applied 14 *** E.O. 12866 Review Draft Do Not Cite, Quote, or Release During Review ***
Appendix Appendix 15 *** E.O. 12866 Review Draft Do Not Cite, Quote, or Release During Review ***
Analytic Base Cases Two IPM base cases were used in the development of the proposal. IPM v.5.14 Receptor, contribution, and illustrative control case analyses for the proposal relied on IPM v.5.14. IPM v.5.15 After these analyses were underway, the EPA released an updated IPM base case, version v.5.15, and the final Clean Power Plan (CPP). The EPA performed a sensitivity analysis to evaluate how this new base case would potentially influence the initial receptor and contribution analyses. Following this analysis, the EPA relied on IPM v.5.15 to quantify upwind obligations and perform the RIA analysis. By using IPM v.5.15, all on-the-books policies, including the CPP, as well as the most current power sector modeling data is included in the base case for this proposal. 16 *** E.O. 12866 Review Draft Do Not Cite, Quote, or Release During Review ***