Oyster Production Trends in Selected States: Insights for Vp Illness Trends
This dataset analyzes oyster production trends in various states such as Washington, Texas, Louisiana, Virginia, Massachusetts, and New Jersey from 2000 to 2016. The data provides insights into changes in oyster production over the years, which may offer valuable information to understand any potential trends in Vp illness incidents.

Download Presentation

Please find below an Image/Link to download the presentation.
The content on the website is provided AS IS for your information and personal use only. It may not be sold, licensed, or shared on other websites without obtaining consent from the author. If you encounter any issues during the download, it is possible that the publisher has removed the file from their server.
You are allowed to download the files provided on this website for personal or commercial use, subject to the condition that they are used lawfully. All files are the property of their respective owners.
The content on the website is provided AS IS for your information and personal use only. It may not be sold, licensed, or shared on other websites without obtaining consent from the author.
E N D
Presentation Transcript
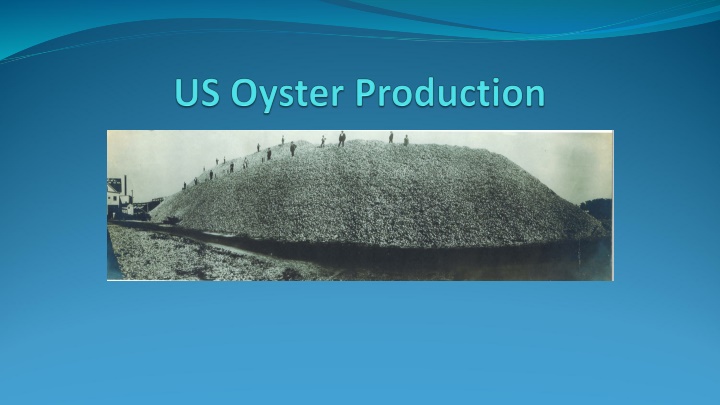
Production Data. NMFS Commercial Fisheries Statistics dataset 2000- 2015 Many caveats .. Select states to get a feel for trends in production Monthly data from MA and NJ from ISSC Do production trends provide any insight into Vp illness trends?
Total Oyster Production 2008 - 2014 100 80 Pounds (Millions) 60 40 20 0 Maine Alabama Oregon Delaware Georgia Maryland Virginia Louisiana Washington California Texas Rhode Island North Carolina New York Mississippi Massachusetts Florida East Coast Florida West Coast
Washington State Washington State 14000000 12000000 10000000 8000000 Pounds 6000000 4000000 2000000 0 2000 2002 2004 2006 2008 2010 2012 2014 2016
Texas Texas 8000000 6000000 Pounds 4000000 2000000 0 2000 2002 2004 2006 2008 2010 2012 2014 2016
Louisiana Louisiana 16000000 14000000 12000000 10000000 Pounds 8000000 6000000 4000000 2000000 0 2000 2002 2004 2006 2008 2010 2012 2014 2016
Virginia Virginia 5000000 4000000 3000000 Pounds 2000000 1000000 0 2000 2002 2004 2006 2008 2010 2012 2014 2016 NMFS VIMS Marine Resource Report No. 2017-7, May 2017
Massachusetts MA Annual Production Massachusetts 50000000 700000 600000 40000000 Number of Oysters 500000 30000000 400000 Pounds 20000000 300000 200000 10000000 100000 0 0 2012 2013 2014 2015 2016 2004 2006 2008 2010 2012 2014 2016 NMFS MA DMF
Massachusetts Massachusetts Monthly Production 6000000 5000000 Number of Oysters 4000000 3000000 2012 2013 2014 2015 2016 2000000 1000000 1 2 3 4 5 6 7 8 9 10 11 12 Month MA DMF
New Jersey New Jersey Annual Production New Jersey Monthly Production 120000 25000 20000 100000 15000 80000 Bushels Bushels 10000 60000 2010 2011 2012 2013 2014 2015 2016 5000 40000 0 20000 2 4 6 8 10 12 14 0 2010 2011 2012 2013 2014 2015 2016 Month NJ DFW
WA TX LA VA NJ MA Summary WA and LA top producing states with relatively consistent production. Texas more variable, decline in recent years? Increasing production in VA, MA and to a lesser extent NJ. Need more complete data .