Pacific Mountain Region Employment Trends 2023
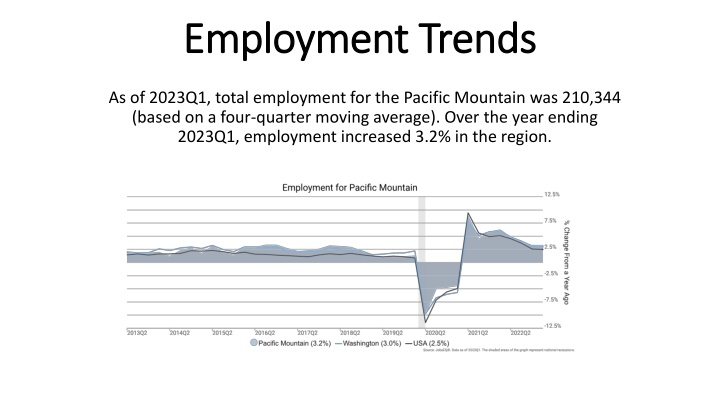
Total employment in the Pacific Mountain region as of 2023Q1 was 210,344, with a 3.2% increase over the year. The unemployment rate was 3.7% in July 2023, lower than the national rate. Average annual wages were $59,688, with a 5.5% increase. The region faces potential supply shortfalls and varying growth rates for occupations based on education levels.

Download Presentation

Please find below an Image/Link to download the presentation.
The content on the website is provided AS IS for your information and personal use only. It may not be sold, licensed, or shared on other websites without obtaining consent from the author.If you encounter any issues during the download, it is possible that the publisher has removed the file from their server.
You are allowed to download the files provided on this website for personal or commercial use, subject to the condition that they are used lawfully. All files are the property of their respective owners.
The content on the website is provided AS IS for your information and personal use only. It may not be sold, licensed, or shared on other websites without obtaining consent from the author.
E N D
Presentation Transcript
Employment Trends Employment Trends As of 2023Q1, total employment for the Pacific Mountain was 210,344 (based on a four-quarter moving average). Over the year ending 2023Q1, employment increased 3.2% in the region.
Occupation demographics by age are modeled based upon employment by occupation at place of residence and zip-code level data from the American Community Survey, 2017-2021. The bureau of labor statistics as a definition for Prime Age which could then be coupled with Labor force participation rates to define the Primary working age would be for a region or county. The visualization below reflects occupational diversity within the PacMtn region.
Unemployment Rate Unemployment Rate The unemployment rate for the Pacific Mountain was 3.7% as of July 2023. The regional unemployment rate was lower than the national rate of 3.8%. One year earlier, in July 2022, the unemployment rate in the Pacific Mountain was 4.8%.
The potential supply shortfall is an underlying force that the market needs to resolve one way or another. While this an important analysis for determining local occupation needs, the occupation gap should be considered along with other regional data including growth and separation forecasts, unemployment rates, wage trends, and award and skill gap analyses.
Wage Wage Trends Trends The average worker in the Pacific Mountain earned annual wages of $59,688 as of 2023Q1. Average annual wages per worker increased 5.5% in the region over the preceding four quarters. For comparison purposes, annual average wages were $68,501 in the nation as of 2023Q1.
Expected growth rates for occupations vary by the education and training required. Employers recruiting for these occupations can potentially resolve gaps in job requirements by creating increased demand and wages enticing more local residents to get training for these occupations.
Education Education Levels Levels Occupations typically requiring a postgraduate degree are expected to grow 1.7% per year, those requiring a bachelor s degree are forecast to grow 1.5% per year, and occupations typically needing a 2-year degree or certificate are expected to grow 1.5% per year.
Awards data are based upon degrees conferred for the academic year 2020-2021 and are provided by the National Center for Education Statistics.
ALICE ALICE (Asset Limited Income Constrained Employed) Total Year County Poverty ALICE Above Households 30,500 32,304 25,085 117,186 214,953 2021 2021 2021 2021 2021 2021 Grays Harbor Lewis Mason Pacific Thurston PacMtn 3,078 4,893 2,943 1,341 12,208 24,463 10% 15% 12% 14% 10% 12% 10,906 7,175 7,104 4,421 26,224 55,830 36% 22% 28% 45% 22% 31% 16,516 20,236 15,038 4,116 78,754 134,660 54% 63% 60% 42% 67% 57% 9,878
Demographics Demographics
Demographics Demographics Continued
PacMtn Employment, Labor and Wage Insights September 2023 JRO+CO PacMtn Data Services Preliminary Data
Labor Productivity for Private Nonfarm in Washington, Percent Change from Year Ago, Annual, Not Seasonally Adjusted 8.0 7.4 6.1 6.0 5.6 5.5 4.0 3.7 2.3 2.1 2.0 1.9 1.8 1.6 1.3 0.6 0.0 0.0 -0.2 -2.0 -2.9 -4.0
% Employment Change YOY for WA and PacMtn: 2008-2023 10.0% 8.0% 6.0% 4.0% 2.0% 0.0% 2008Q2 2008Q3 2008Q4 2009Q1 2009Q2 2009Q3 2009Q4 2010Q1 2010Q2 2010Q3 2010Q4 2011Q1 2011Q2 2011Q3 2011Q4 2012Q1 2012Q2 2012Q3 2012Q4 2013Q1 2013Q2 2013Q3 2013Q4 2014Q1 2014Q2 2014Q3 2014Q4 2015Q1 2015Q2 2015Q3 2015Q4 2016Q1 2016Q2 2016Q3 2016Q4 2017Q1 2017Q2 2017Q3 2017Q4 2018Q1 2018Q2 2018Q3 2018Q4 2019Q1 2019Q2 2019Q3 2019Q4 2020Q1 2020Q2 2020Q3 2020Q4 2021Q1 2021Q2 2021Q3 2021Q4 2022Q1 2022Q2 2022Q3 2022Q4 2023Q1 -2.0% -4.0% -6.0% Washington PacMtn -8.0% -10.0%
PacMtn Establishments: 2019-2022 25,000 19,051 20,000 17,501 17,386 16,560 16,761 16,989 16,550 15,862 15,945 16,014 16,109 16,250 16,120 16,309 14,610 14,584 15,000 10,000 5,000 2019Q1 2019Q2 2019Q3 2019Q4 2020Q1 2020Q2 2020Q3 2020Q4 2021Q1 2021Q2 2021Q3 2021Q4 2022Q1 2022Q2 2022Q3 2022Q4
Total Private Establishments in PacMtn (excluding Lewis County at the moment): 1990-2022 12,000 10,000 8,000 6,000 4,000 2,000 0 1990-01-01 1990-08-01 1991-03-01 1991-10-01 1992-05-01 1992-12-01 1993-07-01 1994-02-01 1994-09-01 1995-04-01 1995-11-01 1996-06-01 1997-01-01 1997-08-01 1998-03-01 1998-10-01 1999-05-01 1999-12-01 2000-07-01 2001-02-01 2001-09-01 2002-04-01 2002-11-01 2003-06-01 2004-01-01 2004-08-01 2005-03-01 2005-10-01 2006-05-01 2006-12-01 2007-07-01 2008-02-01 2008-09-01 2009-04-01 2009-11-01 2010-06-01 2011-01-01 2011-08-01 2012-03-01 2012-10-01 2013-05-01 2013-12-01 2014-07-01 2015-02-01 2015-09-01 2016-04-01 2016-11-01 2017-06-01 2018-01-01 2018-08-01 2019-03-01 2019-10-01 2020-05-01 2020-12-01 2021-07-01 2022-02-01 Thurston Grays Harbor Mason Pacific
PacMtn Employment Volume: 2019-2023 215,000 210,344 210,000 208,707 207,058 205,108 205,000 202,854 202,760 202,252 200,746201,224201,706 199,795 200,000 197,980 196,989 195,462 194,853 195,000 193,069 190,875 190,000 185,000 180,000 2019Q1 2019Q2 2019Q3 2019Q4 2020Q1 2020Q2 2020Q3 2020Q4 2021Q1 2021Q2 2021Q3 2021Q4 2022Q1 2022Q2 2022Q3 2022Q4 2023Q1
Unemployment Rate, WA and PacMtn: 2019-2023 18.0% 16.0% 14.0% 12.0% 10.0% 8.0% 6.0% 4.0% 2.0% 0.0% January 2019 January 2020 January 2021 January 2022 January 2023 February 2019 February 2020 February 2021 February 2022 February 2023 May 2019 May 2020 May 2021 May 2022 May 2023 August 2019 October 2019 November 2019 August 2020 October 2020 November 2020 August 2021 October 2021 November 2021 August 2022 October 2022 November 2022 June 2019 June 2020 June 2021 June 2022 June 2023 March 2019 March 2020 March 2021 March 2022 March 2023 July 2019 December 2019 July 2020 December 2020 July 2021 December 2021 July 2022 December 2022 July 2023 April 2019 April 2020 April 2021 April 2022 April 2023 September 2019 September 2020 September 2021 September 2022 Washington (3.6%) PacMtn (3.7%)
% Change in Av Annual Wage, WA and PacMtn: 2019-2023 12.0% 10.0% 8.0% 6.0% 4.0% 2.0% 0.0% 2019Q1 2019Q2 2019Q3 2019Q4 2020Q1 2020Q2 2020Q3 2020Q4 2021Q1 2021Q2 2021Q3 2021Q4 2022Q1 2022Q2 2022Q3 2022Q4 2023Q1 Washington (1.6%) PacMtn (5.5%)
PacMtn Shift Share - Total Employment Change by Driving Force: 2018-2023 9,000 8,049 8,000 7,000 6,581 6,000 5,000 4,000 3,000 2,000 1,000 0 National Growth Industry Mix Share Local Competitiveness -1,000 -719 -2,000
PacMtn Employment Change by Shift Share Component: 2018-2023 Public Administration Other Services (except Public Administration) Accommodation and Food Services Arts, Entertainment, and Recreation Health Care and Social Assistance Educational Services Administrative and Support and Waste Management and Remediation Services Management of Companies and Enterprises Professional, Scientific, and Technical Services Real Estate and Rental and Leasing Finance and Insurance Information Transportation and Warehousing Retail Trade Wholesale Trade Manufacturing Construction Utilities Mining, Quarrying, and Oil and Gas Extraction Agriculture, Forestry, Fishing and Hunting -3,000 -2,000 -1,000 0 1,000 2,000 3,000 4,000 5,000 National Growth Industry Mix Share Local Competitiveness
PacMtn Current Job Postings (June, 2023) 314 Registered Nurses 191 Retail Salespersons 155 First-Line Supervisors of Transportation and Material Moving Workers, Except 131 Managers, All Other 126 Merchandise Displayers and Window Trimmers 109 Security Guards 108 Fast Food and Counter Workers 86 Stockers and Order Fillers 80 Customer Service Representatives 77 Financial and Investment Analysts 72 Sales Representatives, Wholesale and Manufacturing, Except Technical and Scientific 68 Health Technologists and Technicians, All Other 68 Food Service Managers 67 Laborers and Freight, Stock, and Material Movers, Hand 63 Maintenance and Repair Workers, General 62 Environmental Scientists and Specialists, Including Health 61 Nursing Assistants 59 Janitors and Cleaners, Except Maids and Housekeeping Cleaners 52 Production Workers, All Other 0 50 100 150 200 250 300 350


")

![[PDF READ ONLINE] Mountain Claiming (BIG-Secrets of Mountain Men Book 3)](/thumb/42287/pdf-read-online-mountain-claiming-big-secrets-of-mountain-men-book-3.jpg)