Paired Samples T-Test: When and How to Use for Data Analysis
"Learn when to use a paired samples t-test for comparing means of dependent populations like 'Before' and 'After' measurements. Tutorial and examples provided for conducting the test easily." (Approximately 263 characters)

Download Presentation

Please find below an Image/Link to download the presentation.
The content on the website is provided AS IS for your information and personal use only. It may not be sold, licensed, or shared on other websites without obtaining consent from the author. If you encounter any issues during the download, it is possible that the publisher has removed the file from their server.
You are allowed to download the files provided on this website for personal or commercial use, subject to the condition that they are used lawfully. All files are the property of their respective owners.
The content on the website is provided AS IS for your information and personal use only. It may not be sold, licensed, or shared on other websites without obtaining consent from the author.
E N D
Presentation Transcript
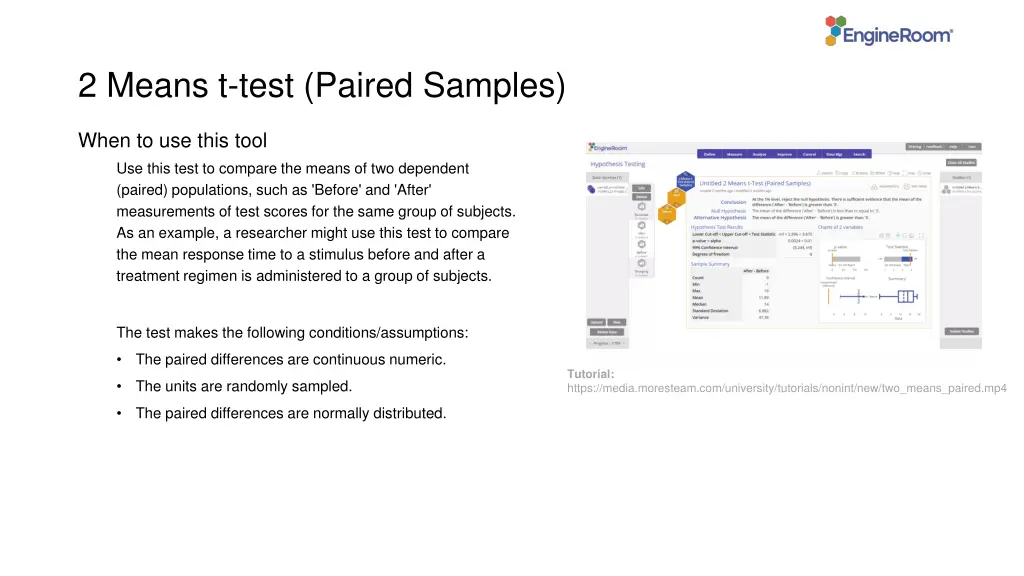
2 Means t-test (Paired Samples) When to use this tool Use this test to compare the means of two dependent (paired) populations, such as 'Before' and 'After' measurements of test scores for the same group of subjects. As an example, a researcher might use this test to compare the mean response time to a stimulus before and after a treatment regimen is administered to a group of subjects. The test makes the following conditions/assumptions: The paired differences are continuous numeric. Tutorial: https://media.moresteam.com/university/tutorials/nonint/new/two_means_paired.mp4 Tutorial: https://media.moresteam.com/university/tutorials/nonint/new/two_means_paired.mp4 The units are randomly sampled. The paired differences are normally distributed.
Using EngineRoom Analyze > Parametric > 2 Means t-Test You can also use the Wizard: Analyze > Hypothesis Testing Wizard
2 Means t-Test (Paired Samples) Example pairedt_exmpldata.xlsx pairedt_exmpldata.xlsx Steps: If using raw data, your data variables may be in two separate columns (unstacked) or in a single column (stacked) with a second column containing the group IDs. The group ID variable should be dragged on to the 'Grouping Variable' drop zone on the study. 1. Drag the After variable onto the Data variable drop zone, then drag the Before variable onto the second Data variable drop zone on the study. 2. Click Continue . 3. Set up the test as shown Alternative Hypothesis: Greater than Significance level: 0.05 Hypothesized Mean Difference: 3 For this example, we have unstacked data on the sales (in thousands) made by 9 associates Before and After a training program. We want to test whether training increased the sales by more than $3K. 4. Click Continue .
2 Means t-Test (Summary Data) Example If you have the sample summary data for the differences of the paired observations, enter them into the test dialog and follow the remaining steps as above: Name: After-Before Sample Size (n): 9 Mean of Diff.: 11.89 Paired Std. Dev.: 6.89 Click Continue .
")

 Example")
 Output")
 Example")
 Output")