Paired t-Test for Weight Loss Drug Efficacy
Conducting a paired t-test to assess the effectiveness of a new weight loss drug on 10 randomly selected subjects. The process involves weighing participants before and after 30 days of drug intake, analyzing the differences, formulating hypotheses, calculating sample statistics, and drawing conclusions based on the results.

Download Presentation

Please find below an Image/Link to download the presentation.
The content on the website is provided AS IS for your information and personal use only. It may not be sold, licensed, or shared on other websites without obtaining consent from the author. If you encounter any issues during the download, it is possible that the publisher has removed the file from their server.
You are allowed to download the files provided on this website for personal or commercial use, subject to the condition that they are used lawfully. All files are the property of their respective owners.
The content on the website is provided AS IS for your information and personal use only. It may not be sold, licensed, or shared on other websites without obtaining consent from the author.
E N D
Presentation Transcript
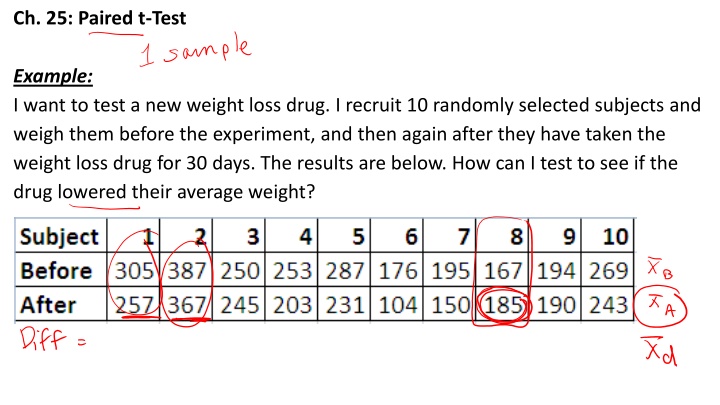
Ch. 25: Paired t-Test Example: I want to test a new weight loss drug. I recruit 10 randomly selected subjects and weigh them before the experiment, and then again after they have taken the weight loss drug for 30 days. The results are below. How can I test to see if the drug lowered their average weight?
Ch. 25: Paired t-Test / Interval We are testing the average (mean) difference Paired Data: Two samples, DEPENDENT (put in L1 and L2) We look at the DIFFERENCES between the two sets of data take 2 samples & combine to 1 sample (subtracting) L3 = L2 - L1 = differences Do a 1-sample t-test or interval on the differences Test/Interval on L3
Conditions: 1 - Paired Data 1- Example: data recorded on same individuals before & after treatment 2 - Random 3 - Normality Conditions met, t distribution, Paired t Test/Interval
HYPOTHESES: Ho: d = # d = mean (average) difference Ha: d # d = _____________ must define what d is
MECHANICS: 1 sample T Test mechanics WRITE FORMULA! df = n - 1
CONCLUSION: - Similar conclusion to 2 sample t test - We reject/fail to reject - We have sufficient/insufficient evidence that on average, group 1 is higher/lower/different than group 2. - CONTEXT! Be sure to answer the original question DO NOT say "difference in the averages"
EXAMPLE: A random sample of 12 sixth graders was given a memory test. They were then enrolled in a 9-month chess program. At the end of the program they were given another memory test. The researchers were interested to see if learning chess would increase memory.
PAIRED t-INTERVAL: CONDITIONS: detailed above MECHANICS: 1 sample t Interval mechanics *Write formula* CONCLUSION: - Similar conclusion to 2 sample t Interval - We are __% confident that on average a Group 1 is between A and B units higher/lower than Group 2.
Example: Complete the interval for the same data set from before ?d = 144.583 sd = 109.741 n = 12
EXAMPLE 2: Same as before: I want to test a new weight loss drug. I recruit 10 randomly selected subjects and weigh them before the experiment, and then again after they have taken the weight loss drug for 30 days. The results are below. The company that makes the drug claims that the patients will lose at least 10 pounds. (a) Test this claim at a 0.05 level of significance. (b) If you reject, complete an appropriate confidence interval (c) Interpret what the confidence level means (d) What is a Type I error in context? (e) What is a Type II error in context? (f) What is Power in context? (g) Interpret the P-value.
(b) If you reject, complete an appropriate confidence interval
(c) Interpret what the confidence level means (d) What is a type I error? (e) What is a Type II error in context? (f) What is Power in context? (g) Interpret the P-value.
(c) Confidence = 90% of all random samples of 10 subjects will produce confidence intervals that contain the true average difference in weight before and after taking the weight loss drug. (d) Type I = Concluding that the average weight lost was at least 10 lbs, when really it was not. Concluding that the drug worked as advertised, when really it did not.
(e) Type II = Concluding that the average weight lost was not at least 10 lbs, when really it was at least 10 lbs. Concluding that the drug did not work as advertised, when really it did. (f) Power = Probability of concluding that the average weight lost was at least 10 lbs, and really it was. Probability of concluding that the drug worked as advertised, and really it did.
(g) P-value = There is a 2.2% chance of getting a sample where the average weight lost from taking the drug is 30.8 lbs or more, if really there is only 10 lbs lost.
TRY THESE: 1. A manufacturer wishes to compare the wearing qualities of two different types of automobile tires, A and B. For the comparison, a tire of type A and one of type B are randomly assigned and mounted on the rear wheels of each of five automobiles. The cars are then operated for a specified number of miles, and the amount of wear is recorded for each tire. Do the data present sufficient evidence to indicate a difference in the average wear for the two tire types? a) Test the hypotheses at the 0.07 significance level. b) Estimate the mean difference in wear by constructing a confidence interval. Use your alpha to determine what level of confidence you should use.
2) In response to a complaint that a particular tax assessor (A) was biased, an experiment was conducted to compare the assessor named in the compliant with another tax assessor (B) from the same office. Eight properties (1 8) were selected, and each was assessed by both assessors. The assessments (in thousands of dollars) are shown in the table. a) Do the data provide sufficient evidence to indicate that assessor A tends to give higher assessments than assessor B? Test using = .05. b) Estimate the mean difference in assessments for the two assessors.


Test this claim at a 0.05 level of significance.")
Test this claim at a 0.05 level of significance.")
 If you reject, complete an appropriate confidence")
 Interpret what the confidence level means")
 Confidence =")
 Type II =")
 P-value =")


 In response to a complaint that a particular tax assessor")
 In response to a complaint that a particular tax assessor")
 In response to a complaint that a particular tax assessor")