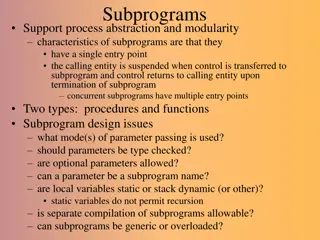
Parameter Sniffing Insights
Speaker Benjamin Nevarez discusses the Query Optimizer's purpose in analyzing and selecting execution plans, the Procedure Cache's role in caching query plans for reuse, and the importance of Parameterization in optimizing query performance. Learn about different types of Parameterization and their impact on query execution efficiency.

Download Presentation

Please find below an Image/Link to download the presentation.
The content on the website is provided AS IS for your information and personal use only. It may not be sold, licensed, or shared on other websites without obtaining consent from the author.If you encounter any issues during the download, it is possible that the publisher has removed the file from their server.
You are allowed to download the files provided on this website for personal or commercial use, subject to the condition that they are used lawfully. All files are the property of their respective owners.
The content on the website is provided AS IS for your information and personal use only. It may not be sold, licensed, or shared on other websites without obtaining consent from the author.
E N D
Presentation Transcript
Profit Planning in Small Enterprises
What is profit planning? Profit has a deep impact on the present, future of an enterprise. It is also a supreme motive of the enterprise. It is a process of deciding profit targets and finding out of activities to be undertaken for the realization of the profit goals. The method of CVP is used for analyzing the profits. determining profits,
Introduction One of the signs of healthy business is that it makes profits inspite of all the risks that are prevailing in the market. It prevails over the uncertainties and overcome the situations in order to earn profits as it is rightly said that where there are risks there are gains. But for the success of an enterprise there is need fro a proper profit planning. The technique which helps to understand the relation between cost popularly called cost volume profit analysis or CVP. price and volume is
Factors influencing the profit planning are Selling price : It can be calculated by deducing cost from the selling price. Thus selling price has direct bearing on profit. Profit can be increased by increasing the selling decreasing the selling price cost remaining constant. Cost price : Increase in cost has adverse effect on the profits and it leads to decrease in it and so decrease in cost increases the profit. Cost can be divided into three heads: Fixed cost Variable cost Semi variable cost price or decreased by
Break Even Analysis/CVP Analysis It is the logical extension of the concept of marginal costing. It is based on the principal of classifying the operating expenses into fixed and variable categories. It determines the relation between cost, price, sales volume and profits. There may be changes in the level of production due to many reasons such as change in the selling price of the product, increase demand for the product etc., in such cases the management wants to know the effect of these changes on the profits of the firm.
The term Break Even Analysis can be termed in narrower as well as broader sense. Used in narrower sense, it means finding out the crisis point. Used in broader sense, it means that system of analysis which determines profits, cost and sales value at different levels of output. The results of such analysis is shown as break even chart.
Break Even Point It is the point where total sales revenues equal total costs. At this point there is neither profit nor loss in the volume of sales or there is zero profit. Sales below this point will result in loss and above point in profit. It is calculated in following manner: Break Even Point (Units of Sales) = Fixed cost/ this Contribution per Unit Break Even Point (Rs. of Sales) =Fixed Cost/ P/V Ratio
Main Assumptions Total cost can be divided into fixed and variable cost components. 2. Fixed cost remains fixed or static irrespective of changes in levels of output. 3. Variable cost is that cost which varies in proportion to levels of output. 4. Selling Price per unit remains constant. 1.
Contribution It is the difference between sales and marginal or variable cost of sales. i.e Selling Price Marginal or Variable Cost OR Fixed Cost + Profit It is an important technique of studying the profitability of a product, department or division. It facilitates in finding out better product mix. It helps in profit planning and maxmisation of profits.
Profit Volume Ratio It establishes relationship between contribution and sales. It is expressed as a percentage and it denotes the relative profitability of various products, processes or departments. Improvement in P/V Ratio will result in increase in the profits of the business. It can be calculated with the help of following formula: P/V Ratio = Contribution/Sales * 100 Contribution = Sales Variable cost
Margin of Safety It is the difference between the actual sales and sales at break even point. It refers to the sales over and above the break even sales. It is the amount by which sales revenue can fall before a loss is incurred. It indicates strengthen or soundness of a business. Larger margin of safety is an indicator of business strength and smaller shows that position of business is risky. Margin of Safety = Actual Sales Sales at break even point = Profit/P/V Ratio
Angle of Incidence It is the angle formed by intersection of total cost lines and sales line. This angle shows the rate of earning profit. Larger angle of incidence is an indicator that profits are being earned at higher rate. Where as smaller angle of incidence shows that the rate of earning profits are low. A larger angle of incidence coupled with higher margin of safety indicates position of the business. the best possible
Importance or Role in Profit Planning Break even chart provides detailed information in a graph in such a way that the management can clearly understand relationship between the cost, volume and profit structure of the company. 2. It help in taking managerial decisions since it shows effect on profits of changes in variable cost and volume of sales. 3. It helps in anticipating costs and profits at various volumes of sales. 4. It helps in knowing effect of increase or reduction in selling price. 5. It helps cost control by measuring operational efficiencies of the plant. 1.
Limitations of Break Even Analysis It is not always possible to divide total cost into fixed and variable cost components e.g telephone bill. 2. Fixed cost remain fixed only upto a certain level of output. Beyond that level it becomes variable, then again it is fixed. 3. Variable cost may not vary in proportion to level of output if economies or diseconomies of scale are in business. 4. SP per unit does not remain constant as it depends on the forces of demand and supply. 1.