Party Polarization and Realignment in American Politics
Explore the causes and effects of party polarization in the United States, from historical realignments to modern-day issues. Learn about the impact of cultural shifts, federal programs, and religious attendance on party identification. Delve into the intra-party dynamics within the GOP and public perceptions of Congress. Gain insights into how these factors have contributed to the current political landscape.

Download Presentation

Please find below an Image/Link to download the presentation.
The content on the website is provided AS IS for your information and personal use only. It may not be sold, licensed, or shared on other websites without obtaining consent from the author. If you encounter any issues during the download, it is possible that the publisher has removed the file from their server.
You are allowed to download the files provided on this website for personal or commercial use, subject to the condition that they are used lawfully. All files are the property of their respective owners.
The content on the website is provided AS IS for your information and personal use only. It may not be sold, licensed, or shared on other websites without obtaining consent from the author.
E N D
Presentation Transcript
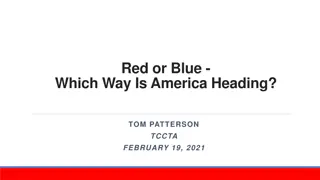
PARTY POLARIZATION - IN THE NATION AND THE CLASSROOM Tom Patterson April 20, 2023
The gradual realignment that fueled today s polarized politics Race 1964 Civil Rights Act, plus Cultural issues late 1960s and 1970s Scope of federal programs 1970s-1990s
Partisan Change 1960 Election Pre-realignment 2000 Election Post-realignment
Key Aspect of the Realignment Reinforcing Issues Going back in time earlier sources of moderation in the American political system Pluralism Cross-cutting identities Incrementalism The new reality Overlapping and therefore reinforcing issues & identities a seedbed for polarization
Correlation between religious attendance and party identification (NES surveys) correlation coefficient 0.18 0.16 0.14 0.12 0.1 0.08 0.06 0.04 0.02 0 -0.02 -0.04 1956 60 64 68 72 76 80 84 88 92 96 2000 4 8
One More Aspect of the Change Intra-Party Takeover of the GOP Throughout most of this period of change, Republican Party was dominated by its Establishment Wing (reflected in presidential nominations of Bush 1 and 2, McCain, Romney) War on the Establishment Wing Rise & institutionalization of the Tea Party (2009-2012) Nomination of Trump in 2016
View of Congress in 2015 (Republicans are in control House & Senate) Percentage with an favorable opinion of Congress Democrats 31 Republicans 23 Source: Pew Research Center poll, 2015
Republicans View of Their Party and Candidate Preference in 2016 Primaries Republican Primary Voters View of Their Party Vote Choice of Republicans Who Feel Party Has Betrayed Them Do you feel betrayed by politicians of Republican Party? Percentage of primary voters Trump 55 Yes 59 Main opponent 45 No 41 Source: 2016 primary exit polls where question was asked. Percentages include those who indicated an opinion/preference.
Cumulative Effect Today s parties Democratic Party: A product of its 1930s-1960s transformation the party of economic security programs, civil rights, cultural liberalism. Reductively, the federal party. Republican Party: A product of its more recent transformation the party of small government (economic sphere) & cultural conservatism. Reductively, the states- rights party. Our parties are as far apart as at nearly any time in their history.
The Partisan Divide Issue Polarization Example Percentage of respondents saying abortion should be allowed in all circumstances. 57 Democrats 42 37 35 27 21 23 18 19 Republicans 13 13 10 1975 1985 1995 2005 2015 2023 Source: Gallup polls
The partisan divide affective polarization example percentage of respondents How Republicans see Democrats "enemies" 57 "opponents" 43 How Democrats see Republicans "enemies" 41 "opponents" 59 Source: CBS News poll, February, 2021
The partisan divide perceptual polarization (alternative realities) example Percentage of respondents believing effects of global warming have already begun Democrats 82 72 70 46 45 45 35 29 Republicans 1997 2007 2017 2021 Source: Gallup polls
A Hardening of the Division Why We Shouldn t Expect Short-term Change The increasing number of uncompetitive states & districts as a result of gerrymandering and the Big Sort primary elections are increasingly decisive and favor candidates from the wing of the party. Political leaders who have no qualms about playing to our divisions. A media system that also plays to the divides and derives financial gain from doing so.
Todays Media System Two Networks, Two Versions of Reality Outlets on the partisan side are fewer and overwhelmingly conservative in orientation Traditional Partisan Source: Benkler, et al, Network Propaganda (New York: Oxford University Press, 2018)
Partisan Sorting: Cable News Audience percentage of partisans who say outlet is a main source of news 6 Fox 93 79 CNN 17 95 MSNBC 5 Democrats Republicans Source: Pew Research Center poll, 2019
Social Media Partisan Echo Chambers Sharing on Twitter of media-created Information about Covid Democrats less than 1% of shared messages that originated with partisan media Republicans nearly 50% of their shared messages originated with partisan media Source: Sebastian Blum, Master s thesis, Harvard University, 2022.
HOW AND WHEN MIGHT POLARIZATION SUBSIDE
A feature of todays politics thats historically unusual and a barrier to reducing polarization Intense Party Competition The two parties our closely matched, which is rare in the history of our parties.
Closely Matched Parties presidency average margin of popular-vote victory in presidential elections 19 16 10 8 8 3 1901-1920 1921-1940 1941-1960 1961-1980 1981-2000 2001-2020
Closely Matched Parties: Average Margin of House Majority Average House Majority (number) 114 105 68 59 45 27 1899-1920 1921-1940 1941-1960 1961-1980 1981-2000 2001-2020
Closely Matched Parties: Average Margin of Senate Majority Average Senate Majority (number) 24 24 20 13 11 4 1899-1920 1921-1940 1941-1960 1961-1980 1981-2000 2001-2020
Why Close Competition Fosters Polarization Historically, when closely matched, each party is dedicated to undermining the other party in hope of winning the next election: The single most important thing we want to achieve is for President Obama to be a one-term president, said Republican Senate leader Mitch McConnell in 2009. Dead on arrival, said Democratic House Speaker Nancy Pelosi in 2019 on Trump s legislative agenda.
Historically, when one party has been much stronger than the other, they have acted differently The stronger party has focused on governing. It isn t worried about losing the next election. The weaker party has moved closer to the stronger party and avoided demonizing it in hopes of drawing away enough of its supporters to become competitive. Our polarization likely won t end until one or the other party achieves an unassailable majority position.
Could that party be the Republicans? Among the reasons: Greater support than the Democrats at the state and local levels Recently have begun to cut into Democrats advantage with the nation s two fastest-growing demographic groups Hispanics and Asian Americans.
Party control of state offices percentage of officeholders 52 Governor 48 54 State Atty General 46 56 State senators 44 55 State house members 45 Republican Democrat
Could that party be the Democrats? Among the reasons: Since 2004, young voters have strongly supported the Democratic Party in presidential and midterm elections
Youth Vote (ages 18-29) percentage of two-party presidential vote 67 62 63 60 55 Democratic nominee 51 49 Republican nominee 45 40 37 33 38 2000 2004 2008 2012 2016 2020 Source: Exit polls, 2000-2020
The cumulative effect of Democratic gains among young adults percentage of two party-presidential vote in 2020 43 ages 18-44 57 52 ages 45 & over 48 Trump Biden Source: 2020 exit polls, based on 2-party vote only
ADDRESSING PARTY POLARIZATION IN THE CLASSROOM
Polarization in the classroom unwanted outcomes Unwanted outcomes include: Name-calling and worse Spiral of Silence those in minority shut down Close-mindedness from hearing only the like- minded
Some things I do Rules civility deliberation, not debate Empower those who believe that speaking up might work against them
A typical result when I poll my students on their political ideology percentage of students liberal 65 moderate 20 conservative 15
Americans Political Ideology percentage of students liberal 36 moderate 25 conservative 37 Source: Gallup poll, 2021.
Talking about Misinformation My students see misinformation as a problem but believe that the problem is centered on the other side of the partisan divide, not their side. I try to open their minds a bit by suggesting that it s a problem affecting all of us.
Examples of factual claims from 2020 Donald Trump faked having Covid-19 in order to win sympathy votes Joe Biden is mentally impaired Dr. Anthony Fauci funded a lab in Wuhan to develop the coronavirus If reelected, Donald Trump planned to eliminate social security and Medicare Kamala Harris was not born in United States CDC manipulated numbers to exaggerate fatalities from Covid-19 President Trump went to the hospital while president after suffering a stroke Vote counting machines overcounted the Biden vote
None are true, but each is believed by tens of millions of Americans percentage of respondents saying statement is true Trump cut soc sec 48 Biden mentally impaired 45 Vote machines rigged 43 CDC faked Covid 42 Trump faked Covid 41 Trump had stroke 31 Fauci funded Wuhan 27 Harris not a citizen 27 Source: Indiana University s Observatory on Social Media survey, November 2020
Confirmation Bias Our psychological tendency to interpret claims in ways that align with our preexisting beliefs and biases.
Confirmation Bias affects Republicans & Democrats alike - accepting false claims that align with one s partisanship 57 Trump faked Covid 17 47 Trump had stroke 16 Democrats Republicans 46 Trump cut soc sec 6 19 Fauci paid Wuhan 34 12 Harris not citizen 38 19 CDC faked Covid 54 23 Vote machines rigged 76 22 Biden mentally 82 Source: Indiana University s Observatory on Social Media survey, November 2020
A final example approaching polarization through an analytic lens My goal here is to try to get them to understand the other side rather than judge it.
COVID-19 Biggest health threat of past century deaths per 100,000 Americans COVID-19 295 Flu 13 Note: COVID-19 death rate is period before vaccine became widely availabe
Public health was not the only issue economic downturn was the other 23.1 21 Unemployed (in millions) 17.8 16.3 14.7 13.3 11.1 10.2 7.1 5.8 Unemployment rate (percent) 4.4 3.5 Feb Mar Apr May Jun Jul Source: U.S. Department of Labor
Responses to the COVID-19 Pandemic U.S. has a federal system of government in which power is constitutionally divided between the national government and the state governments. One of the constitutional powers reserved to the state governments is public health. State governors have more authority than the president over public health mandates.
Governors Response Restrictions on Social Gatherings Same pattern held for mandates on masks and restrictions on business activity Time lapse since first reported community transmission in US 1 15 days or less 3 7 16-20 days 15 11 21-25 days 4 7 more than 25/none 2 Republican governor Democratic governor Source: Christopher Adolph, et al, Pandemic Politics: Timing State-Level Social Distancing Responses to COVID-19, Journal of Health Politics, Policy and Law, August 2020, pp. 1-17.
Covid Vaccination Rates State ranking in vaccinations per capita (as of 4/18/21) 6 Best 10 4 5 5 Next-to-best 10 7 Middle 10 3 5 5 Next-to-worst 10 0 Worst 10 10 Democratic governor Republican governor Note: Based on those who are fully vaccinated. The rankings vary only slightly if based on single dose only
Covid Deaths (as of 4/16/2021) States with: Republican governor 159/100,000 Democratic governor 126/100,000 Source: Derived by author from New York Times Covid data base. Excludes the 6 states at epicenter of first wave of COVID when protective measures were not in place.
Economic dimension (jobs lost) State ranking in non-farm jobs lost per capita (between Feb 2020 and Feb 2021) 1 Best 10 9 3 Next-to-best 10 7 5 5 Middle 10 6 Next-to-worst 10 4 8 Worst 10 2 Democratic governor Republican governor Source: Carsey School of Public Policy, University of New Hampshire
Thank you Open to your response to any of the above, and please share with us your suggestions for handling polarization in the classroom.
To obtain a copy, contact Michael Gedatus Michael.Gedatus@mheducation.com


")


")
")